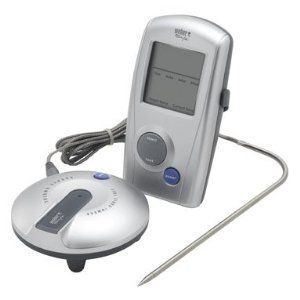
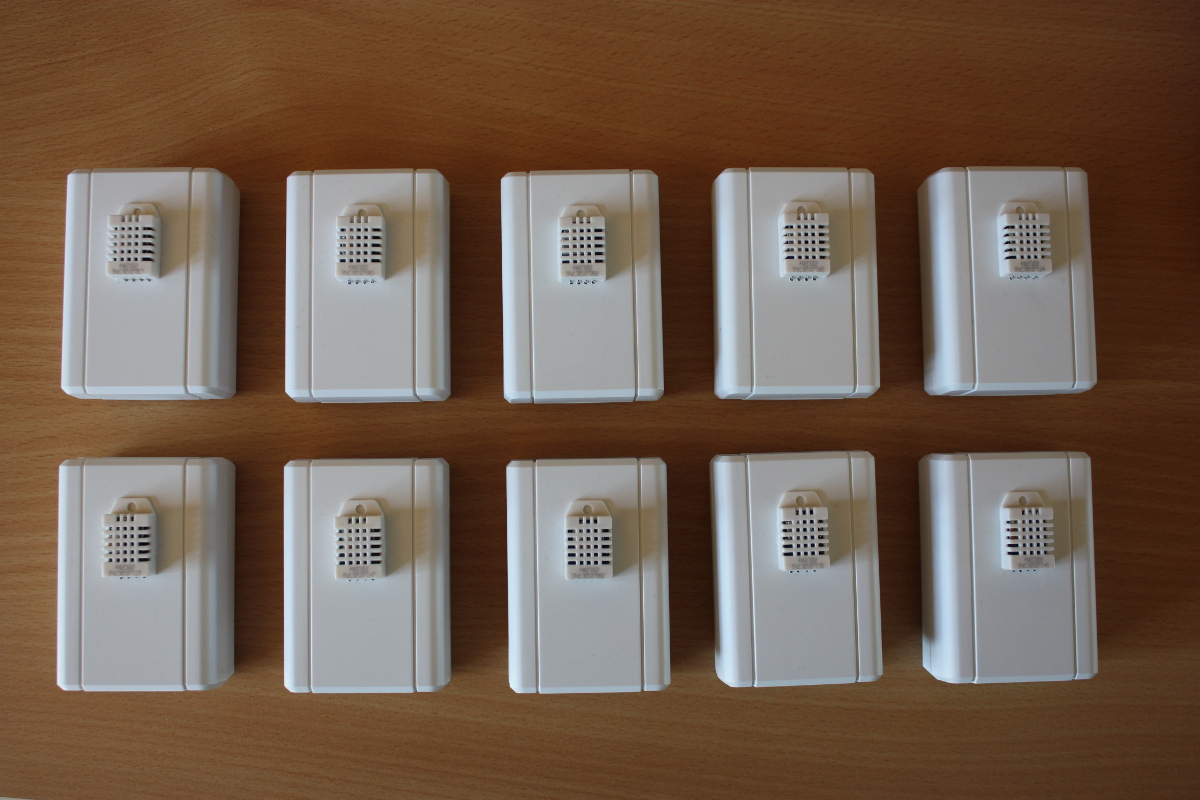
So, I just bought a brand spanking new blood pressure monitor. My wife is a nurse and we have been talking about getting one for some time. After browsing the market, we settled on a Beurer BM 65. It is a very nice piece of kit and it comes with a USB plug for PC connectivity. Exciting, right? Unfortunately, the software is Windows-only. Bummer..

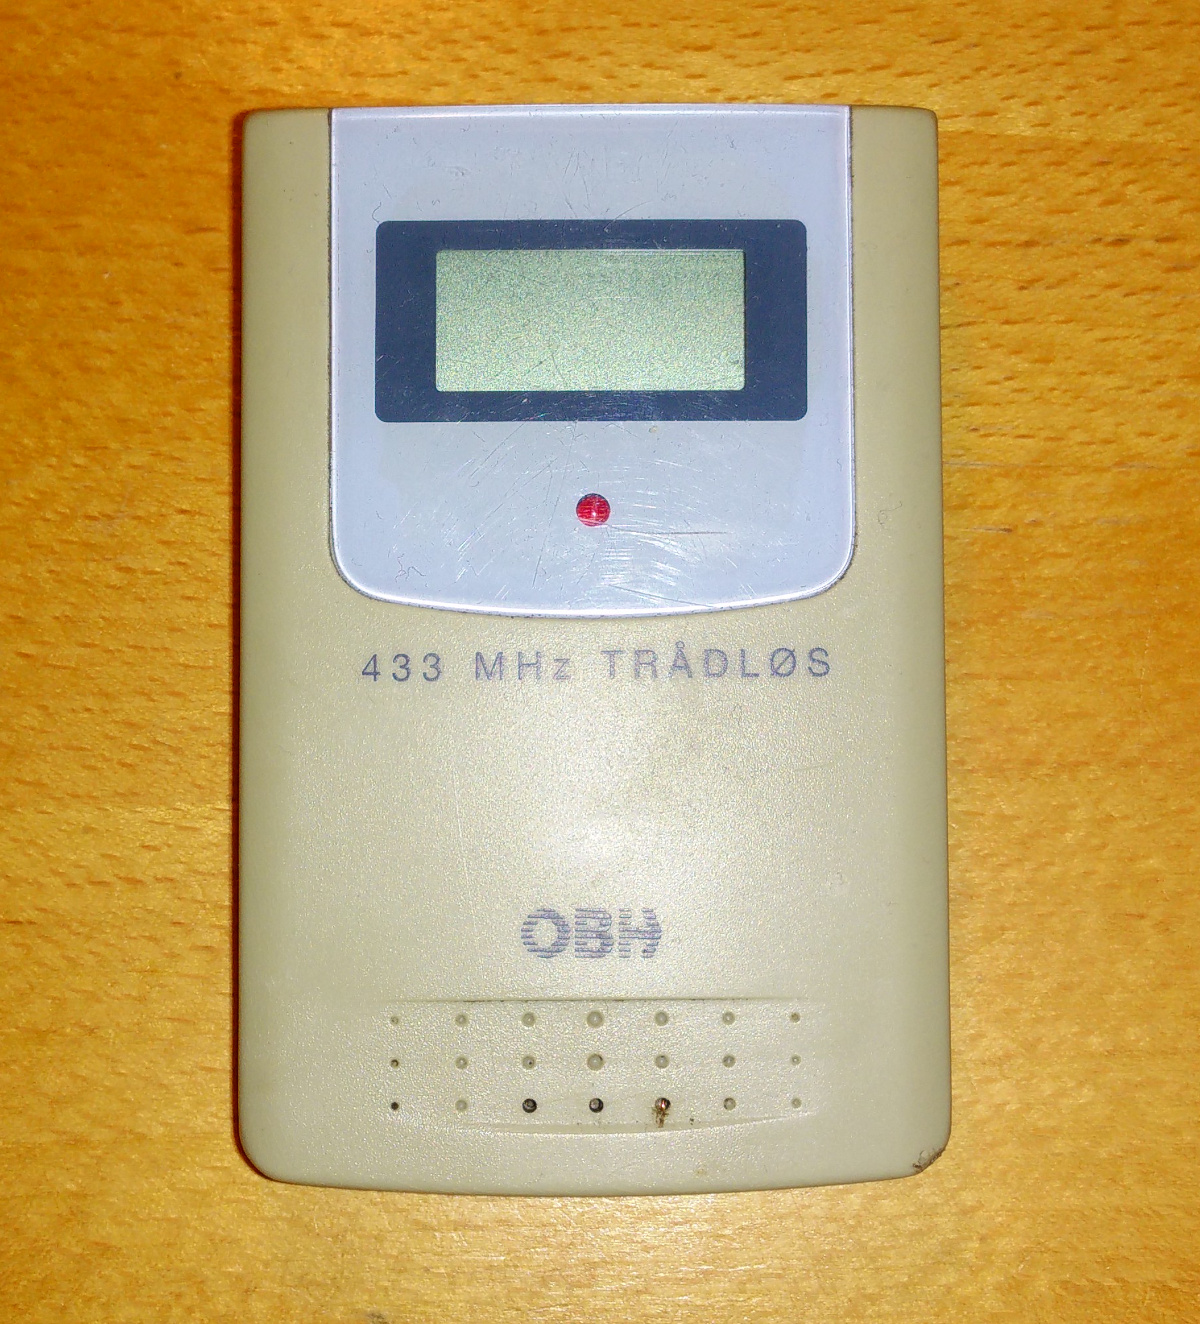
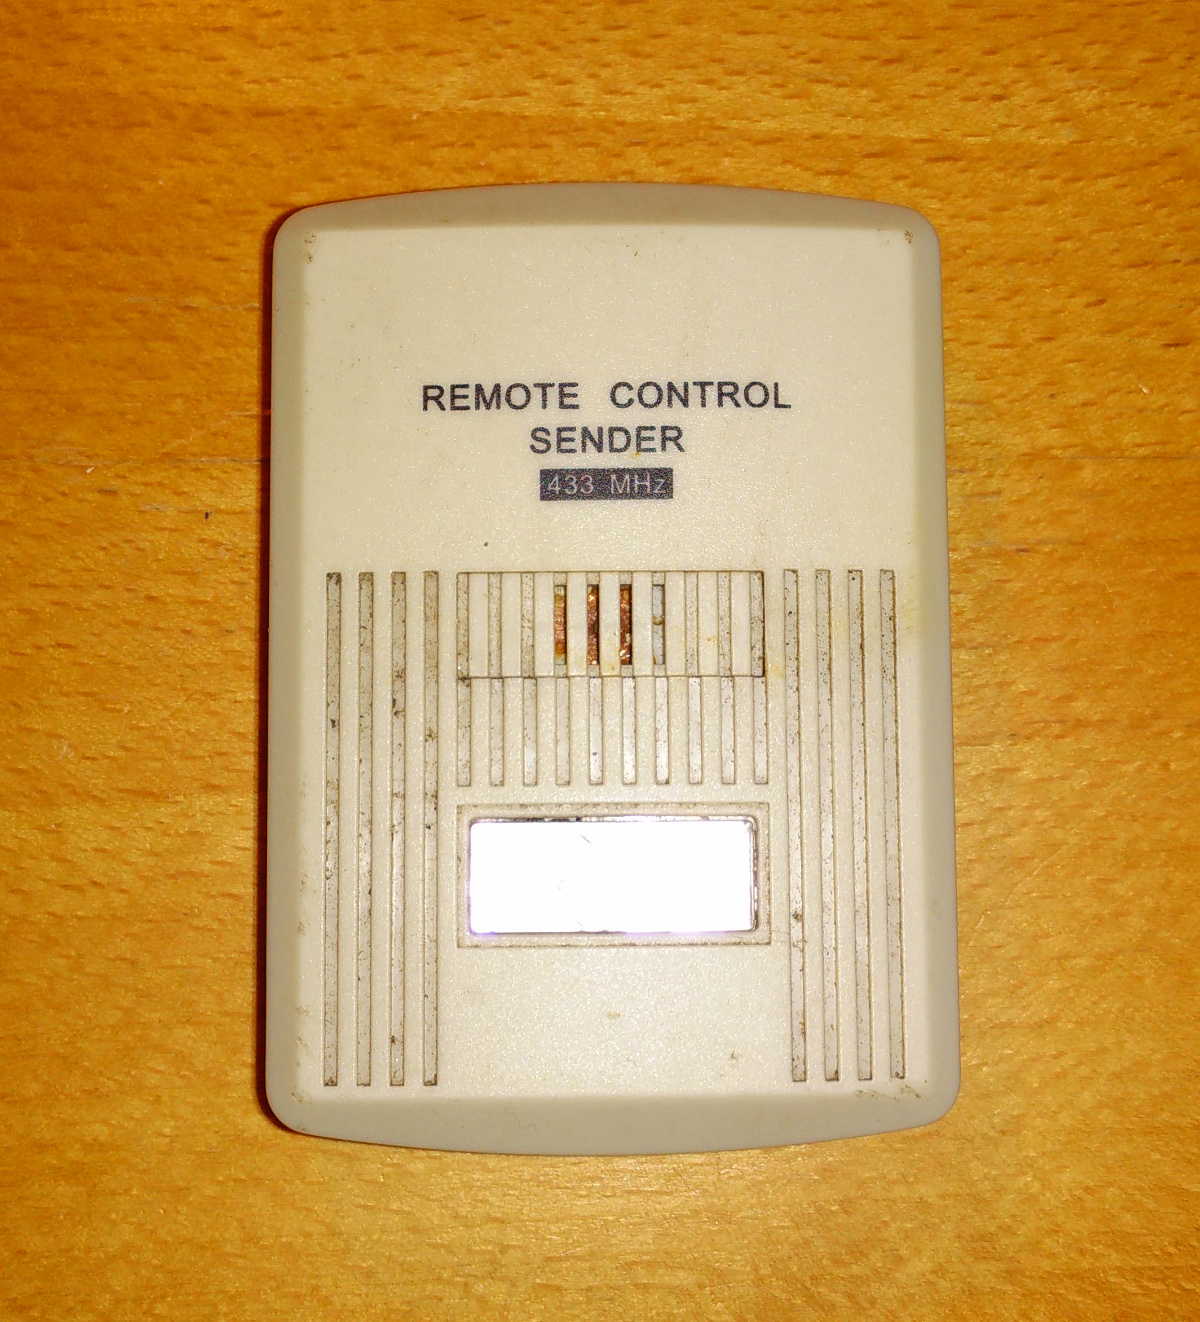
Beurer BM 65
Well, then it’s obviously my duty to reverse-engineer it. Let’s get started then! A quick Google search tells me that others have had success with the Beurer PM70 (a heart rate monitor) and success with the Beurer BG64 (a diagnostic scale). They seem to use different protocols, though.
Reverse engineering the protocol
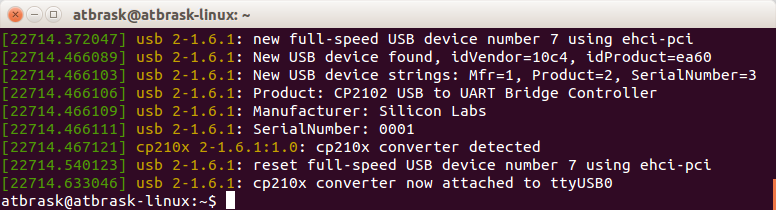
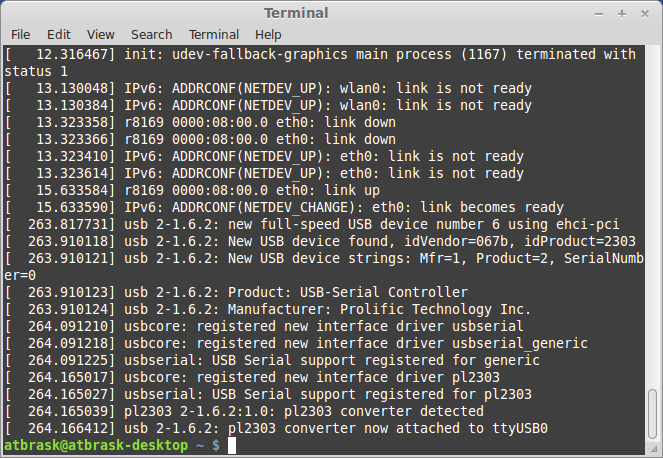
When the BM 65 is plugged in, it enumerates as 067B:2303, which is a Prolific Technology PL-2303 USB-to-serial controller. Interesting.. The problem is therefore reduced to guessing the serial protocol it uses.
Output from dmesg
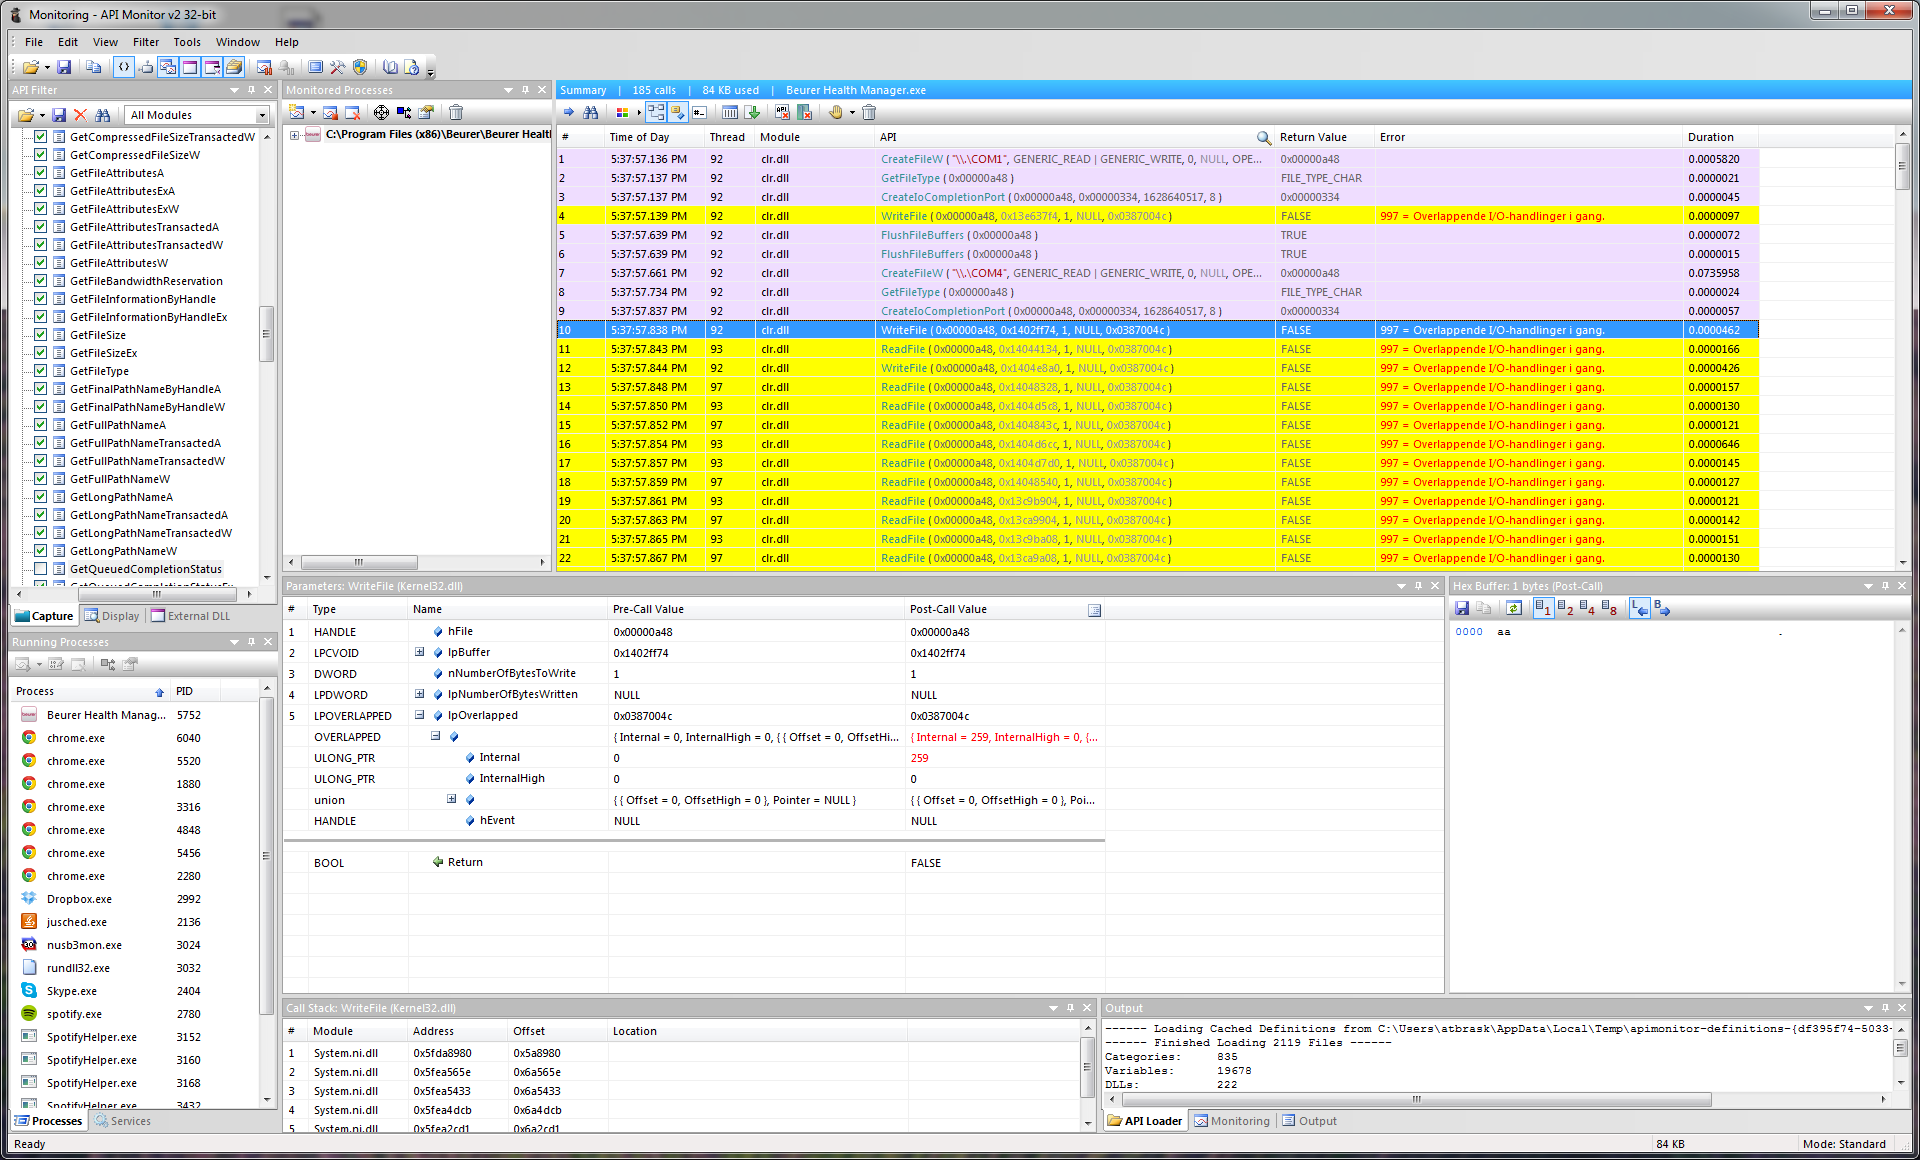
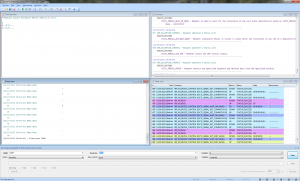
On my Linux box it gets mapped to /dev/ttyUSB0 with no issues, as this chip is supported in the kernel. But how to communicate with it? We need to sniff the protocol… Beurer provides a free Windows-only tool called Health Manager for communicating with the device, as well as a subset of their other products. Luckily, it’s possible to eavesdrop on serial ports in Windows, and my gaming rig runs Windows 7. There is a SysInternals tool for this called Portmon, but it seems to work very poorly on Win7 x64. Next, I tried a tool called API Monitor v2. As the communication with the device is through a fake serial port, we should be able to sniff the relevant Windows API calls.
Lo and behold! It works! It seems that SetCommState in Kernel32.dll is used to configure the COM port (4800 baud 8N1).

The SetCommState call where the serial connection is set up to 4800 baud 8N1.
Let’s then see if we can deduce the actual communication.. After some digging around I successfully limited the captured API calls to just the file I/O stuff in Kernel32.dll. The Health Manager tool tries all available COM ports until it gets a correct response. After that, we just have to follow the yellow brick road of WriteFile and ReadFile API calls. It only writes 1 or 2 bytes per call (depending on the command) and all reads are single byte reads.
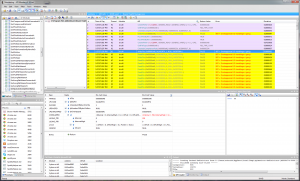
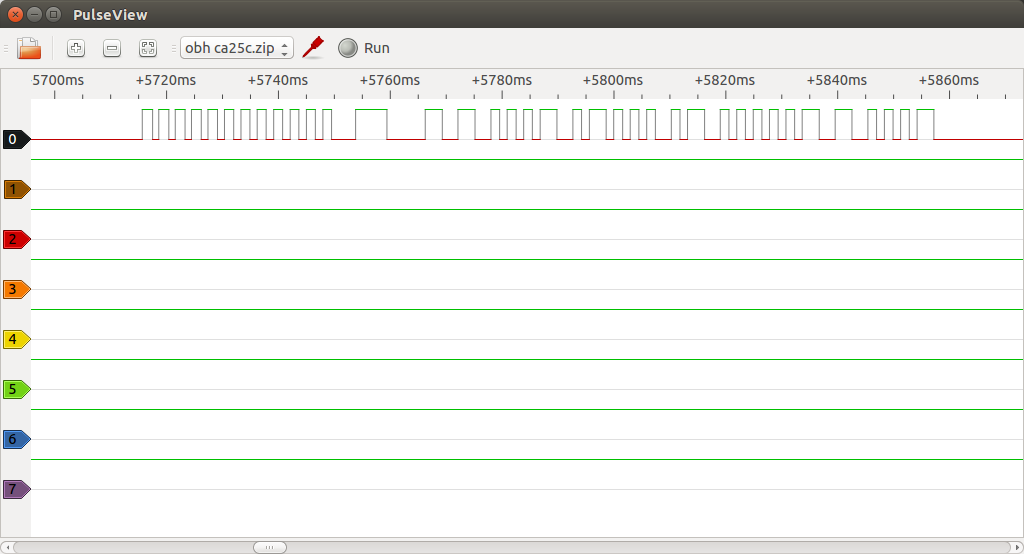
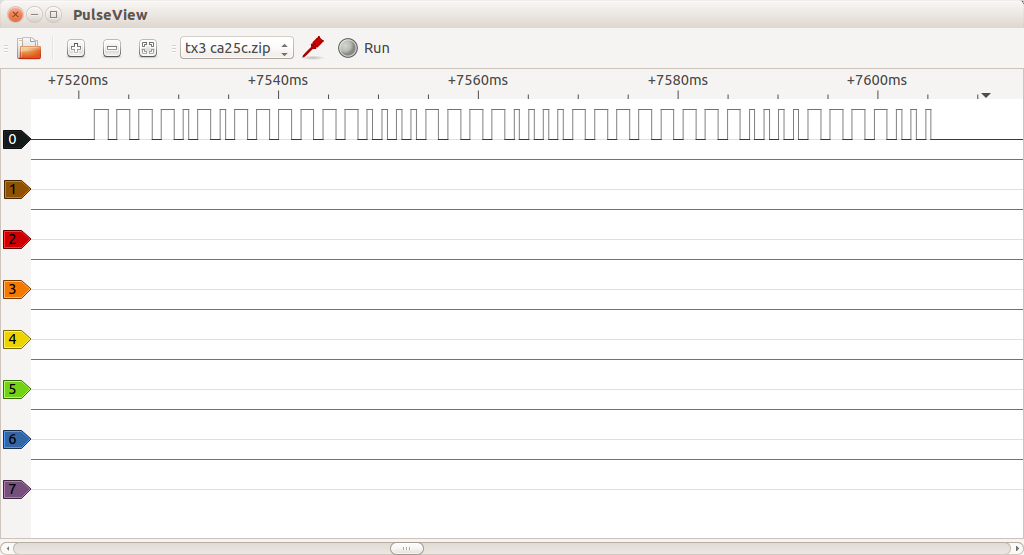
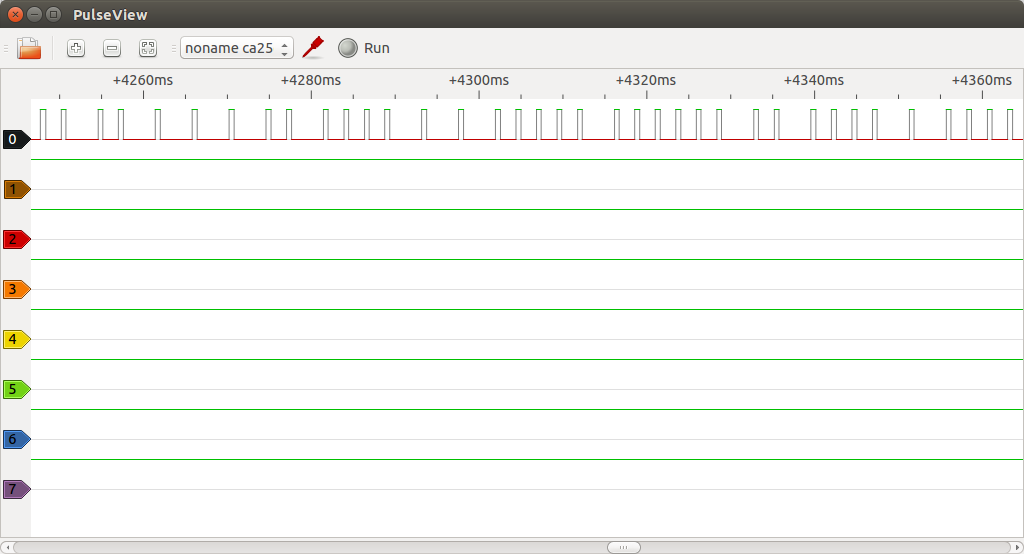
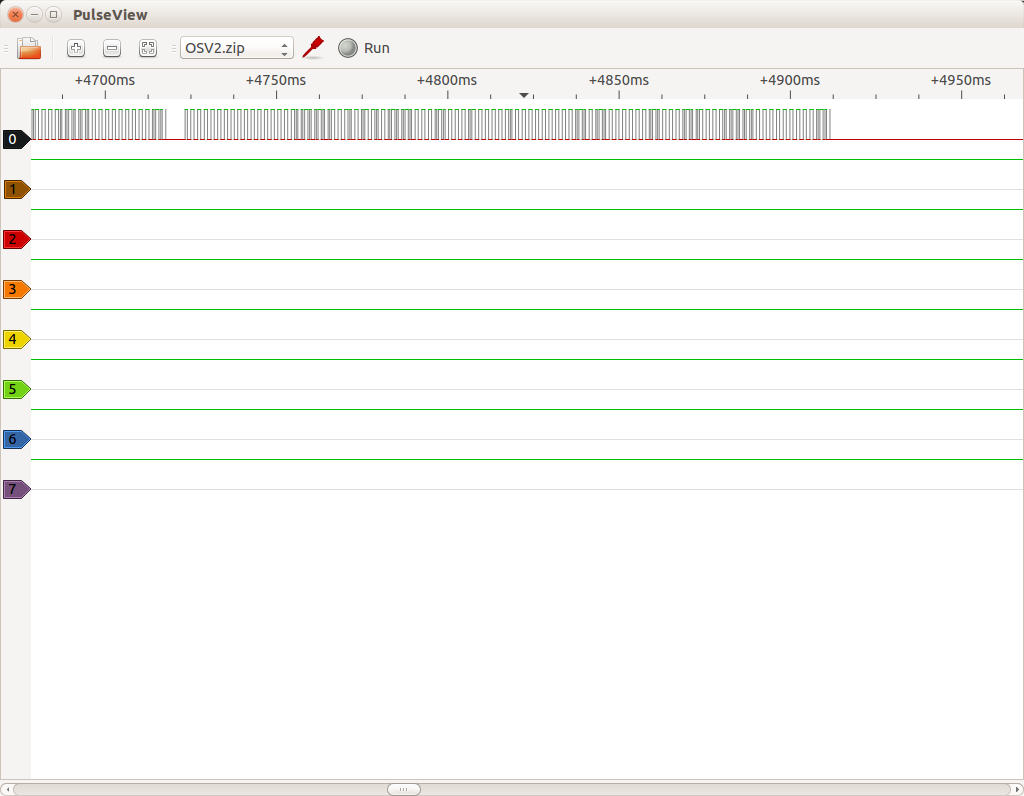
Serial data transfer
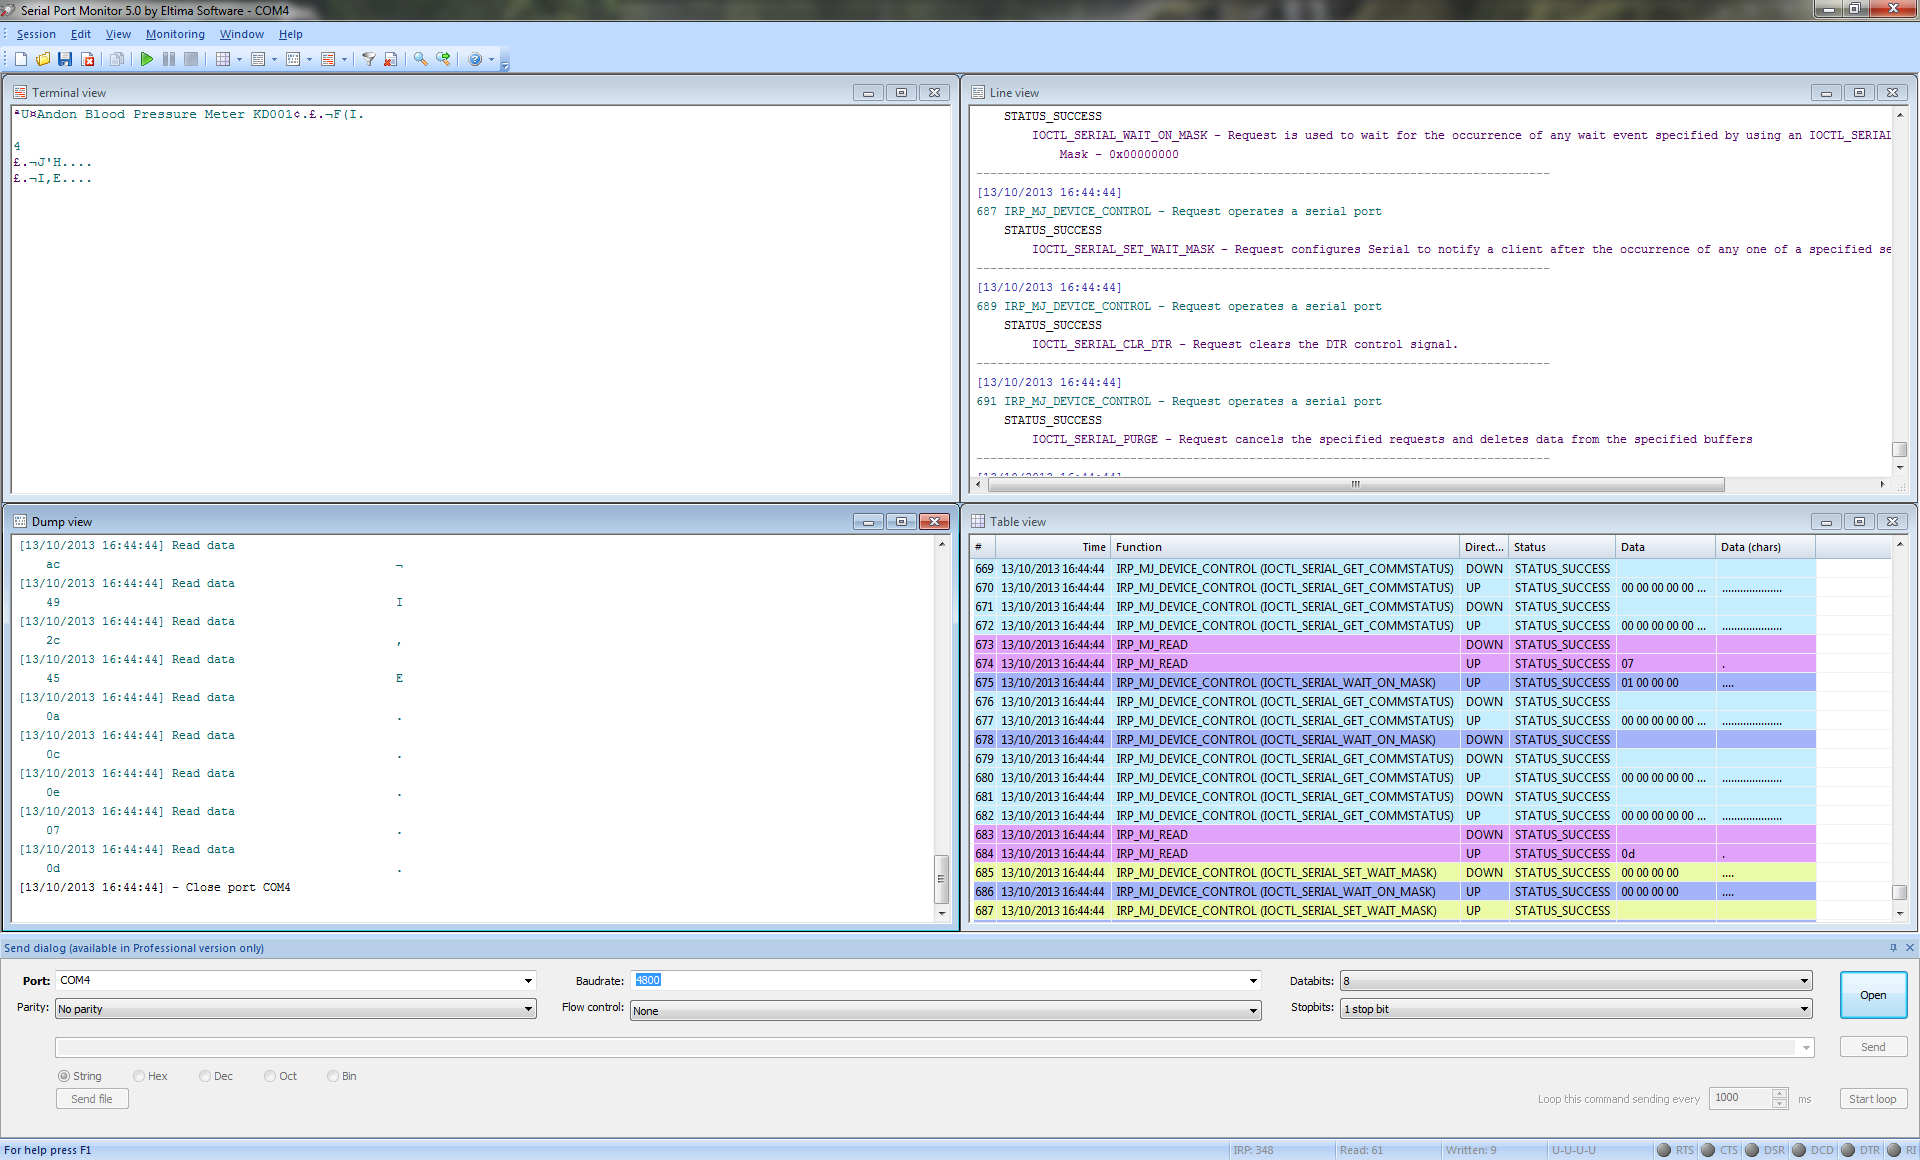
This API Monitor tool is a bit tedious for this, so I tried Serial Port Monitor by Eltima Software instead. It is a shareware program with a 14 day trial, but that’s enough for this purpose. A serial dump of a sequence of 3 measurements looks something like this:
Captured serial communication
In table form, transferring a set of three measurements goes like this:
| Sent to device | Received from device | My interpretation |
| 0xAA | | Ping? |
| 0x55 | Pong! |
| 0xA4 | | Get description |
| "Andon Blood Pressure Meter KD001" | Device description |
| 0xA2 | | How many measurements? |
| 0x03 | 3 measurements! |
| 0xA3 0x01 | | Get measurement 1 |
| 0xAC 0x66 0x37 0x4E 0x0A 0x11 0x16 0x2A 0x0D | Measurement 1! |
| 0xA3 0x02 | | Get measurement 2 |
| 0xAC 0x62 0x35 0x5F 0x0A 0x0E 0x12 0x0C 0x0D | Measurement 2! |
| 0xA3 0x03 | | Get measurement 3 |
| 0xAC 0x64 0x3D 0x55 0x0A 0x0C 0x0E 0x09 0x0D | Measurement 3! |
After the last byte, the connection is terminated. Apparently, this device is made by a company called Andon. And it seems that it only transmits data about a single user at a time. Let’s have a look at a single measurement:
| Byte value | My interpretation | Description |
| 0xAC | 0b10101100 | Status bits? Magic number? |
| 0x66 | 102 + 25 = 127 mmHg | Systolic blood pressure (offset by 25) |
| 0x37 | 55 + 25 = 80 mmHg | Diastolic blood pressure (offset by 25) |
| 0x4E | 78 BPM | Pulse |
| 0x0A | 10 = October | Month |
| 0x11 | 17 | Day of month |
| 0x16 | 22 | Hours |
| 0x2A | 42 | Minutes |
| 0x0D | 13 = 2013 | Year |
And Bob’s your uncle! We have now successfully reverse engineered the protocol. Well.. Almost.. I haven’t got a clue about the first byte of each measurement. It might be a magic number, but it’s probably some status bits. Besides blood pressure and pulse, the device also registers cardiac arrhythmia. If this information is recorded and if a measurement is always 9 bytes, it would have to be stored in these bits.
I mentioned that the device seemed to be made by Andon. After a bit of digging, I found some evidence for this. The document from dabl Educational Trust says:
“Andon is an OEM manufacturer for the BM 65. Despite the different designs, the BM 65 is functionally the same as the Andon KD-5915 with added dual user, averaging and uploading features but without the voiced results.”
It seems that some of the other Andon devices also support USB. I wonder if the protocol is the same as for the BM 65?
Implementing a Python module for the Beurer BM 65
Let’s make a rudimentary data downloader in Python using our newly acquired knowledge about the protocol. I’m using Python 2.7 on a reasonably new Linux Mint installation. The code is reasonably basic, omitting any kind of error handling.
For those who don’t want to copy code from here, you can also pull a copy from GitHub.
Disclaimer:
The code is free to use, but do so at your own risk.
If you brick your device, it’s not my problem.
[code language=”python”]
import sys, serial
class Measurement(object):
def __init__(self, data):
self.header = data[0]
self.systolic = data[1] + 25
self.diastolic = data[2] + 25
self.pulse = data[3]
self.month = data[4]
self.day = data[5]
self.hours = data[6]
self.minutes = data[7]
self.year = data[8] + 2000
self.time = “{0}-{1:02}-{2:02} {3:02}:{4:02}”.format(self.year,
self.month,
self.day,
self.hours,
self.minutes)
def getBytes(self):
return [self.header,
self.systolic – 25,
self.diastolic – 25,
self.pulse,
self.month,
self.day,
self.hours,
self.minutes,
self.year – 2000]
def __repr__(self):
hexBytes = [‘0x{0:02X}’.format(byte) for byte in self.getBytes()]
return “Measurement([{0}])”.format(‘, ‘.join(hexBytes))
def __str__(self):
return “\n”.join([“Header byte : 0x{0:02X}”,
“Time : {1}”,
“Systolic pressure : {2} mmHg”,
“Diastolic pressure : {3} mmHg”,
“Pulse : {4} BPM”]).format(self.header,
self.time,
self.systolic,
self.diastolic,
self.pulse)
class BeurerBM65(object):
def __init__(self, port):
self.port = port
def sendBytes(self, connection, byteList, responseLength = 1):
connection.write(”.join([chr(byte) for byte in byteList]))
response = connection.read(responseLength)
return [ord(char) for char in response]
def bytesToString(self, bytes):
return “”.join([chr(byte) for byte in bytes])
def getMeasurements(self):
ser = serial.Serial(
port = self.port,
baudrate = 4800,
parity = serial.PARITY_NONE,
stopbits = serial.STOPBITS_ONE,
bytesize = serial.EIGHTBITS,
timeout = 1)
pong = self.sendBytes(ser, [0xAA])
print “Sent ping. Expected 0x55, got {0}”.format(hex(pong[0]))
description = self.bytesToString(self.sendBytes(ser, [0xA4], 32))
print “Requested device description. Got ‘{0}'”.format(description)
measurementCount = self.sendBytes(ser, [0xA2])[0]
print “Found {0} measurement(s)…”.format(measurementCount)
for idx in range(measurementCount):
yield Measurement(self.sendBytes(ser, [0xA3, idx + 1], 9))
print “Done. Closing connection…”
ser.close()
if __name__ == “__main__”:
conn = BeurerBM65(sys.argv[1])
for idx, measurement in enumerate(conn.getMeasurements()):
print “”
print “MEASUREMENT {0}”.format(idx + 1)
print measurement
[/code]