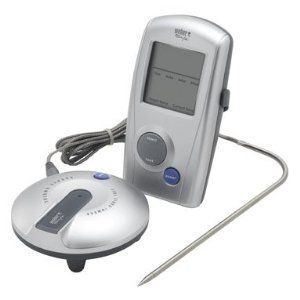
In our living room we have an “Ecoteck Francesca” wood pellet stove that helps us keep a reasonable temperature during winter. The problem is, however, that the remote control is horribly bad (yes, it has a friggin’ remote control). At this point I have already had to replace the buttons in it once, as the old ones were beginning to wear out.

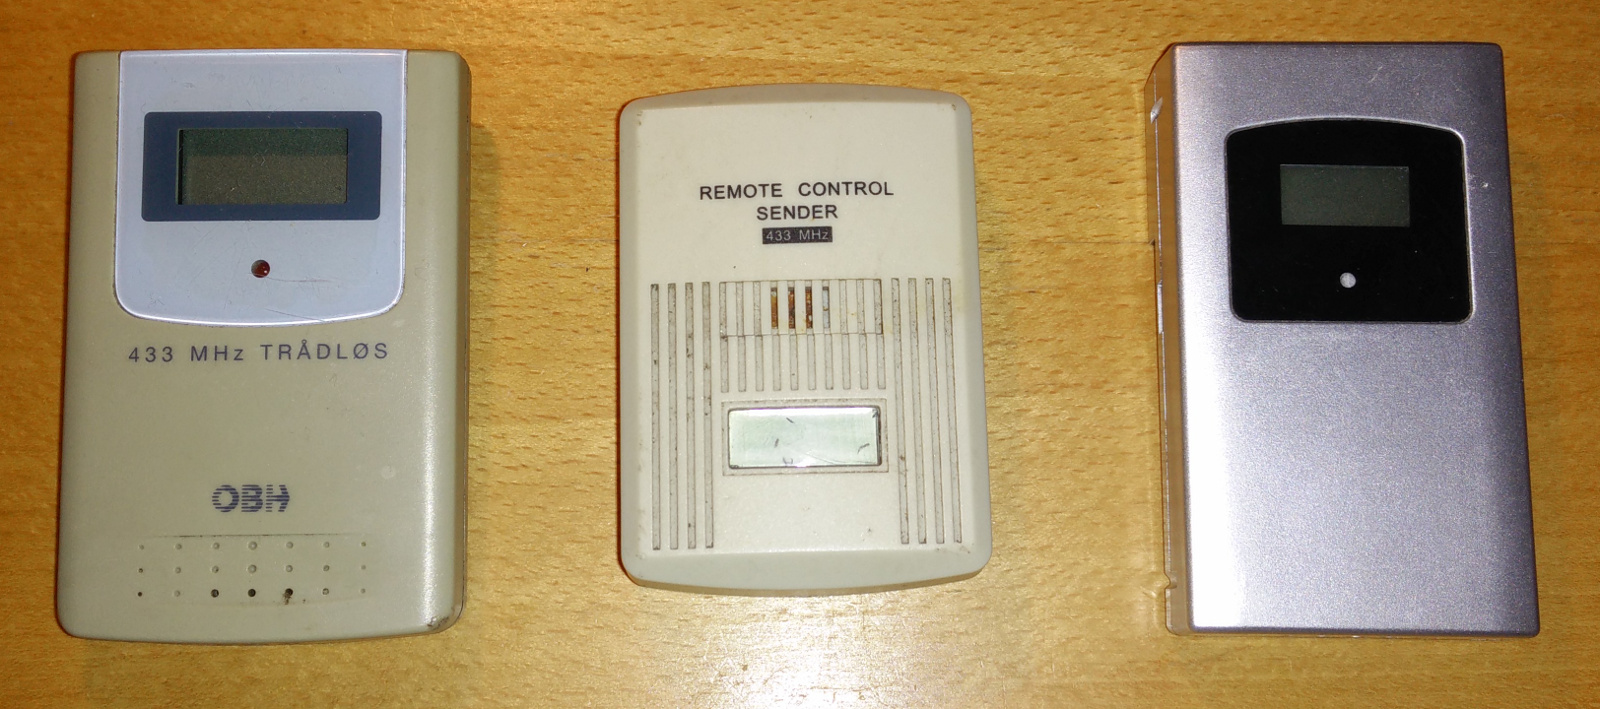
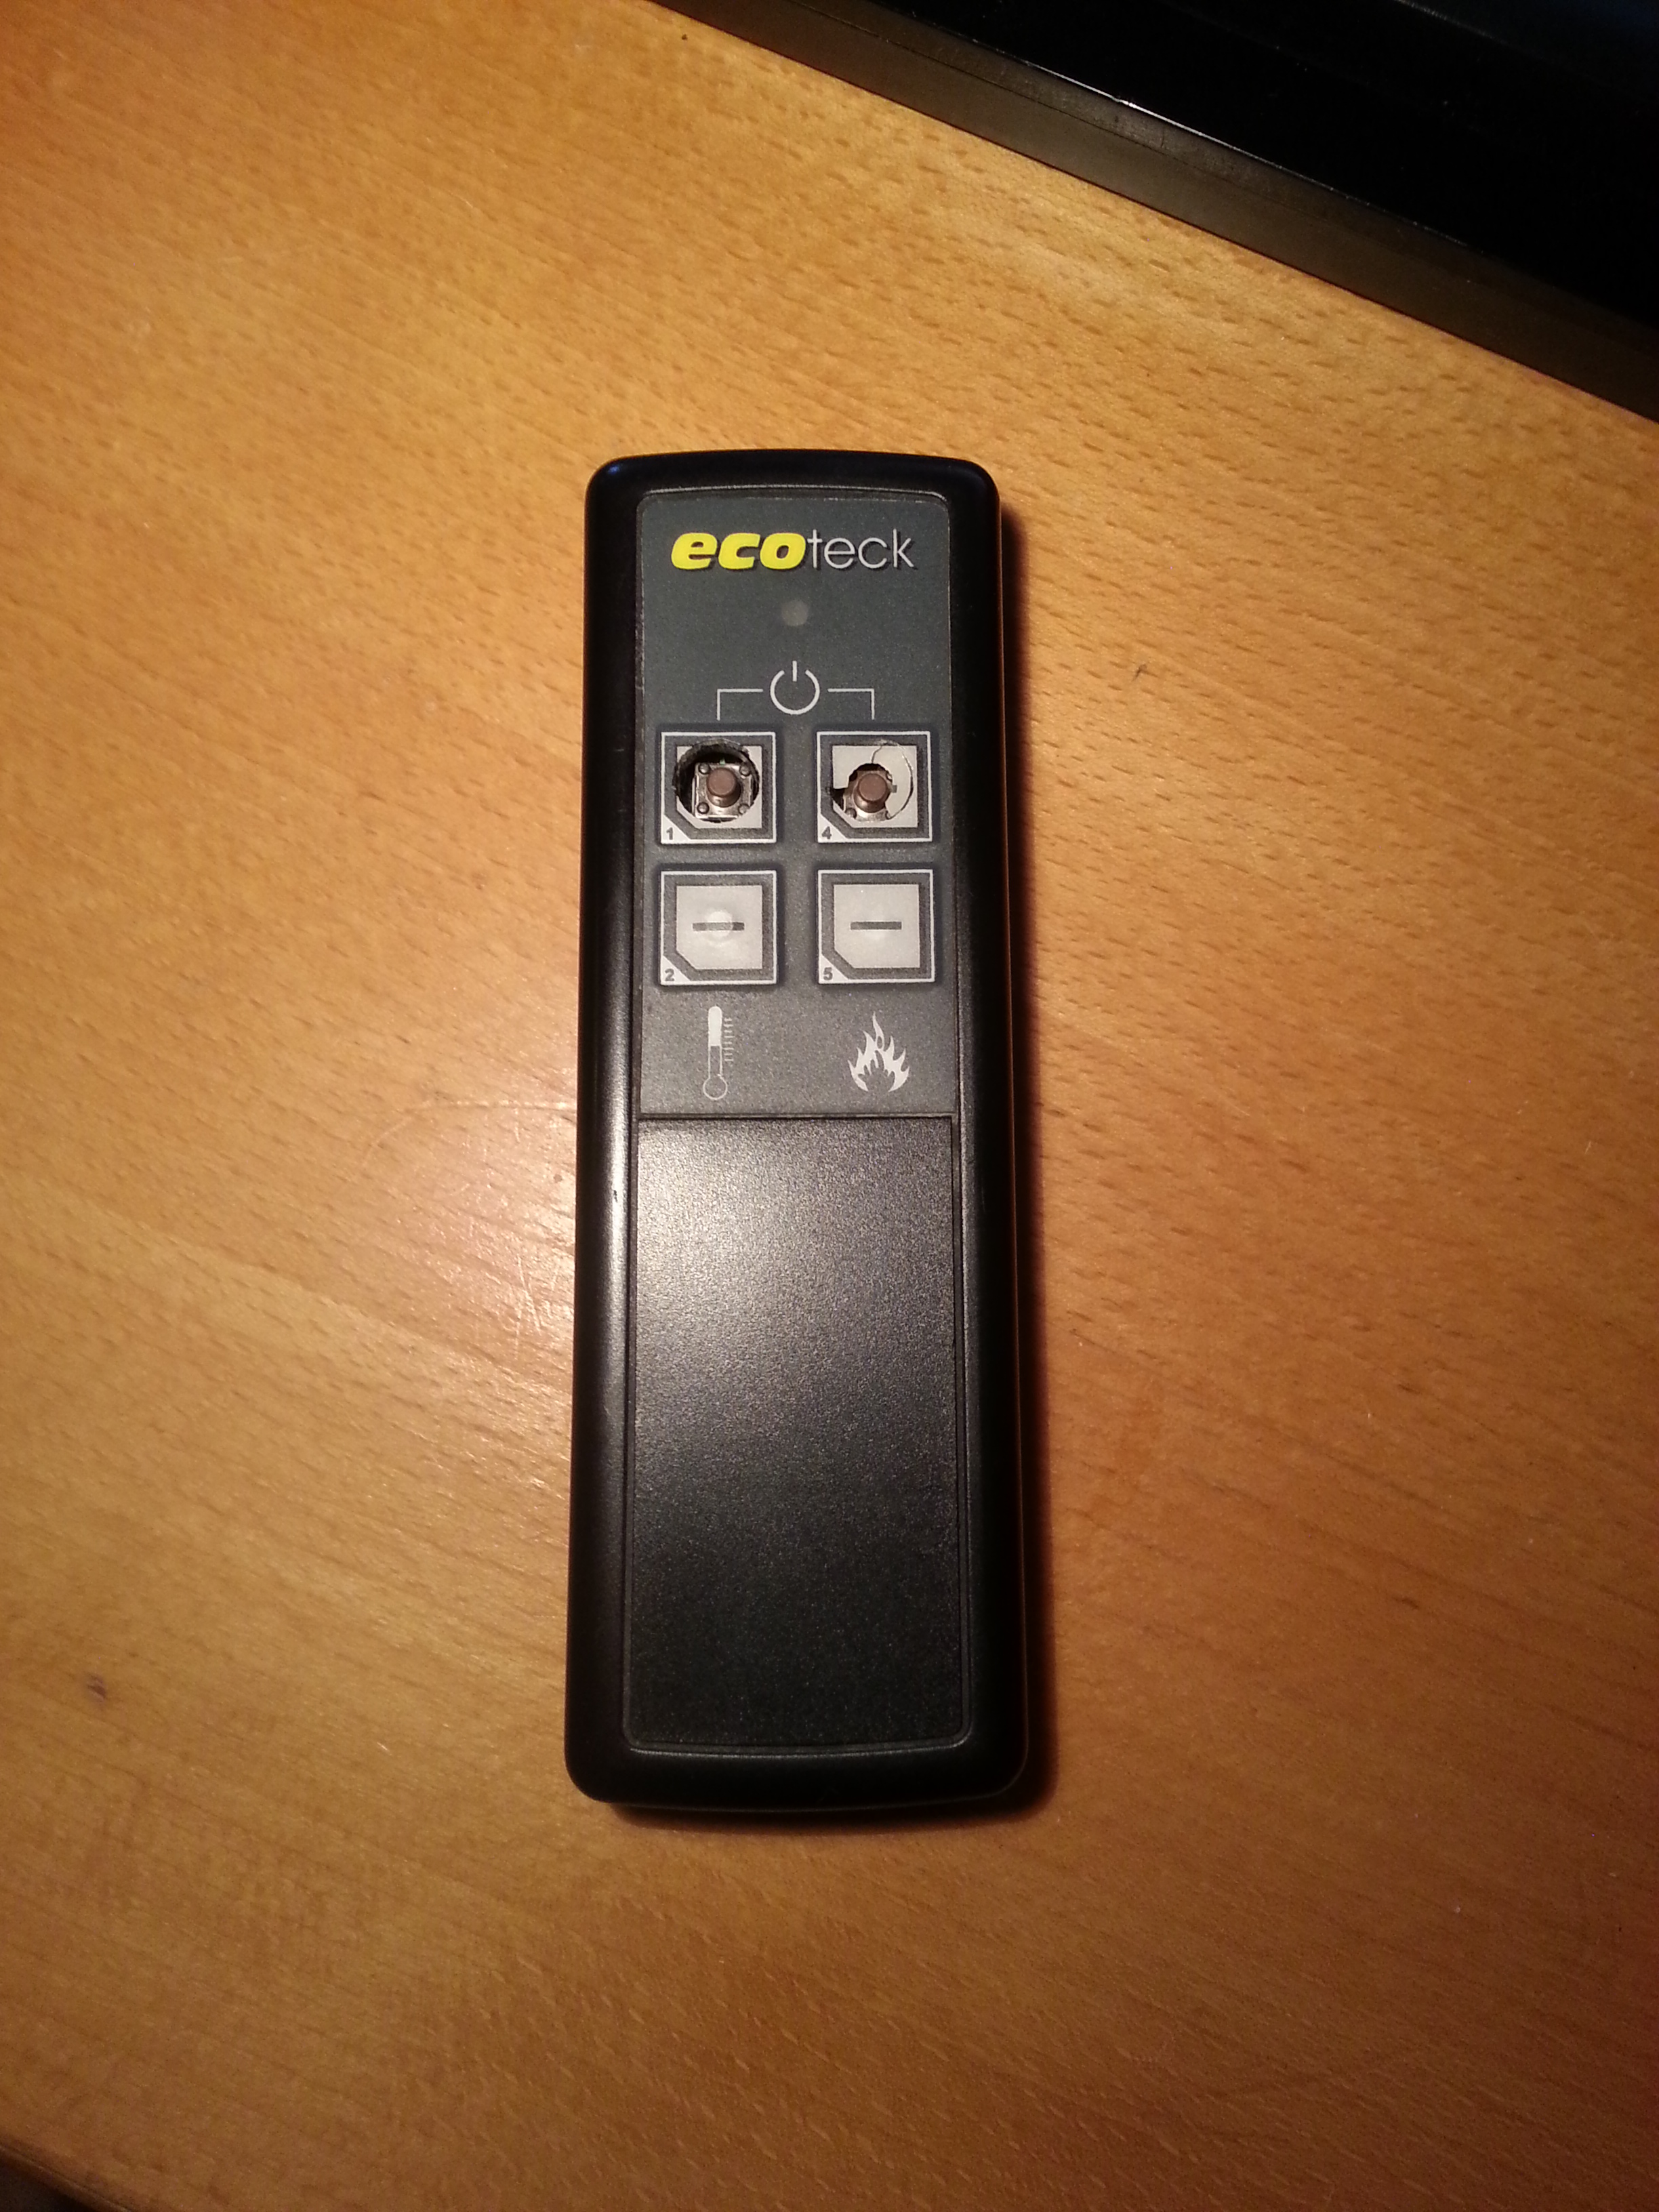
Ecoteck remote control
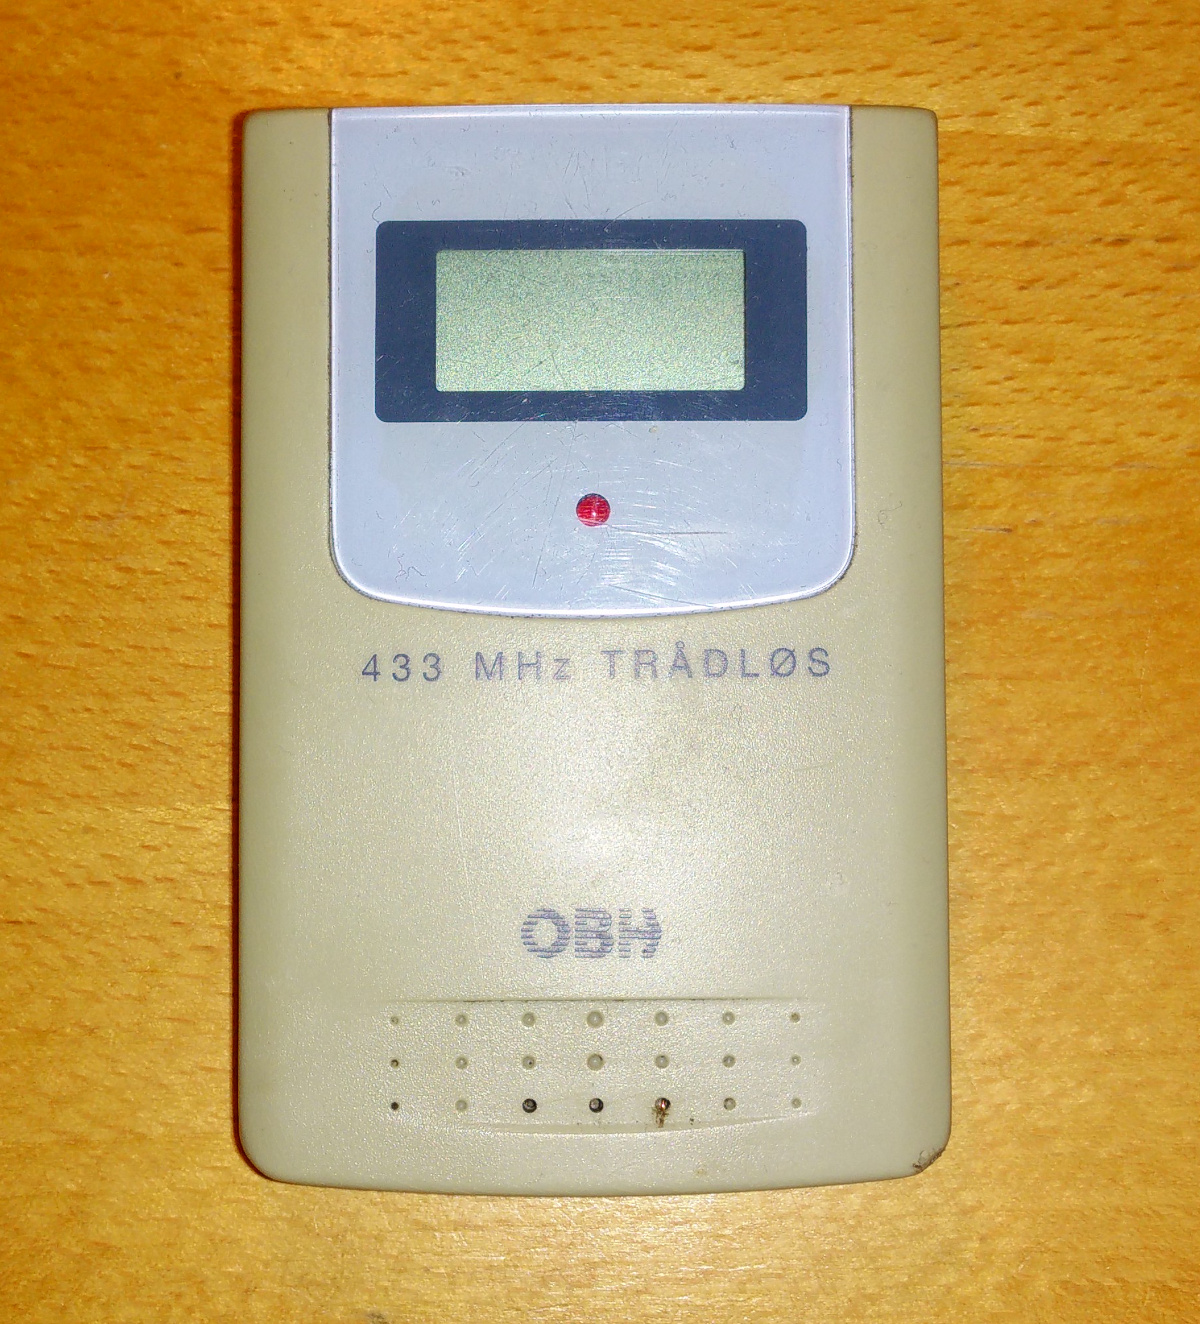
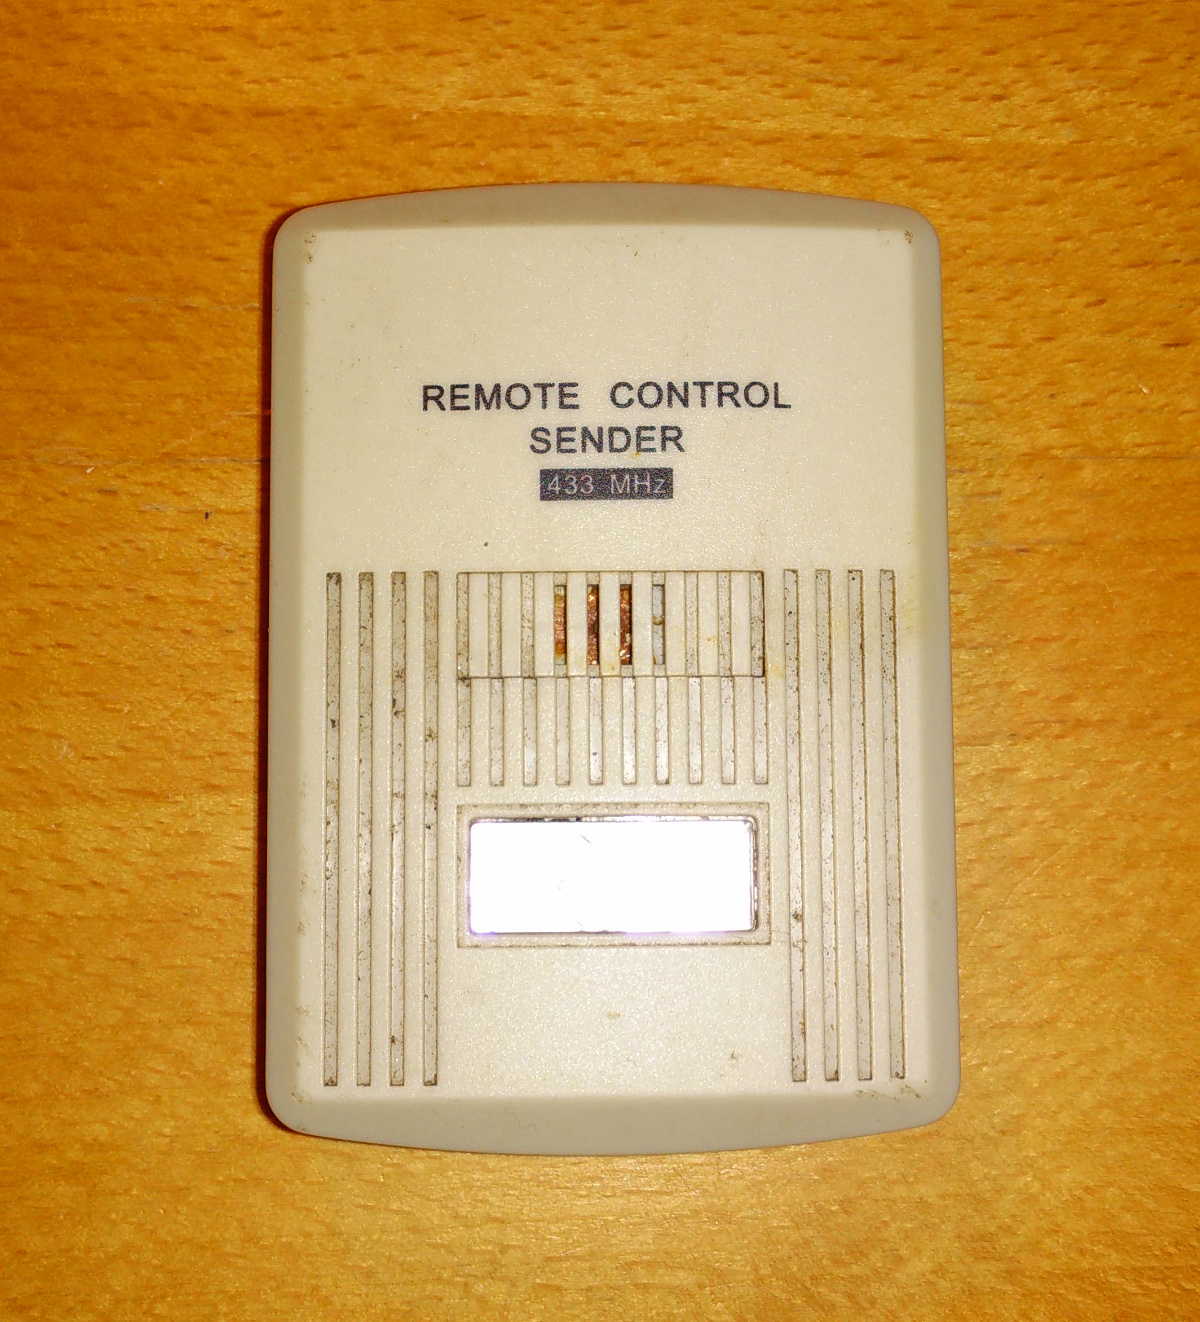
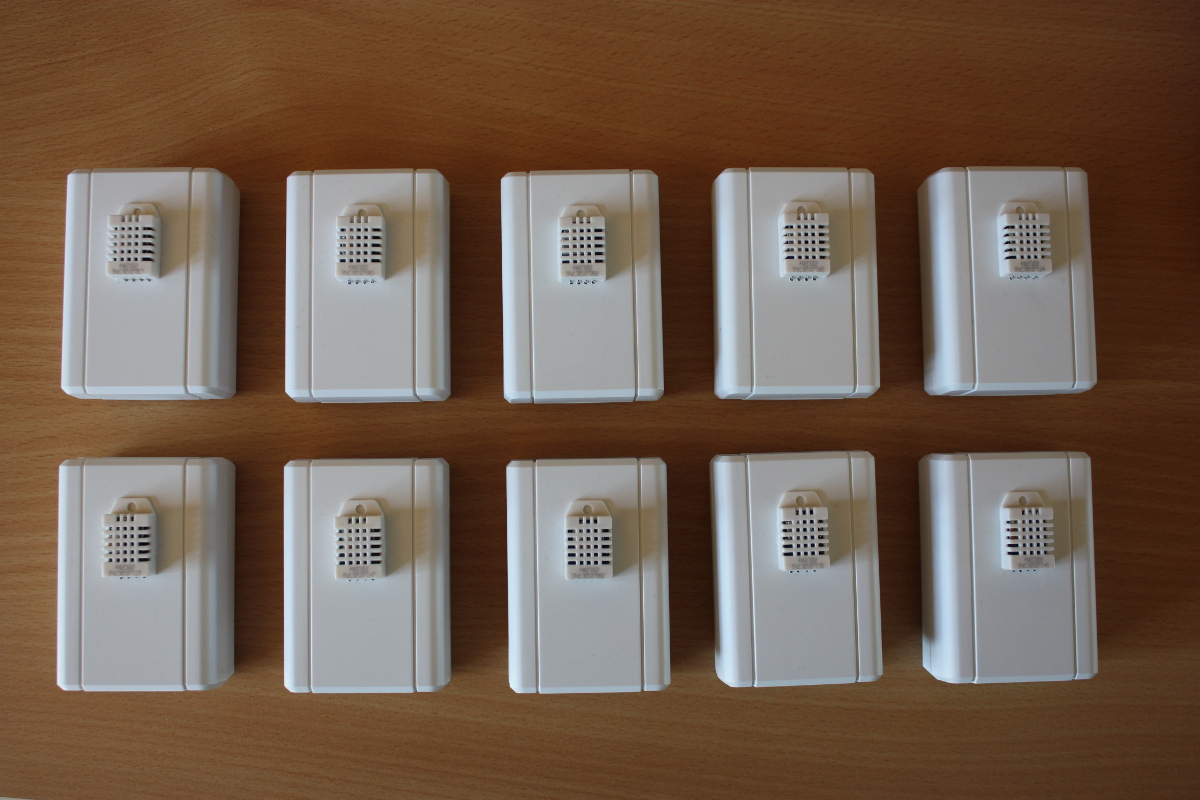
There are four buttons. Two for adjusting the target air temperature and two for adjusting the level of flames or something. Pressing the two uppermost buttons at once turns the stove on or off. I haven’t looked at other Ecoteck models, but the codes in this post may also work for other models that has the same control electronics. The front panel looks like this:
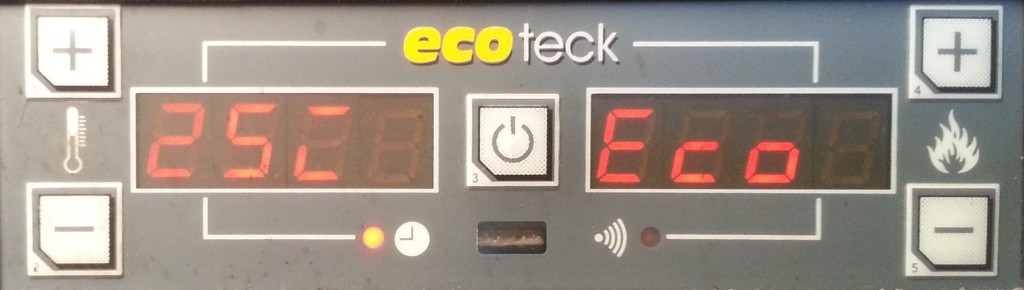
Ecoteck Francesca front panel
So, for the long run we might have to find some sort of replacement of this remote control. Fortunately, our Samsung tablet has an IR transmitter on-board that would be perfect for this. There’s even an easy to use Android API for accessing it. The problem is then that the tablet has no built-in way of “recording” the IR signal from the old remote. And the protocol is nowhere to be found online (until now, that is). So before we can create an Android app, we need to get the codes and modulation settings from the old remote control.
How to get the codes
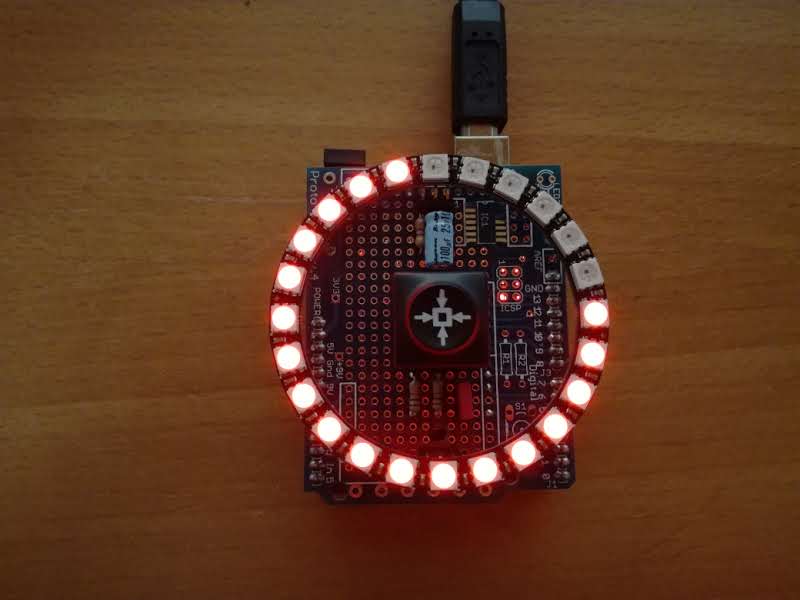
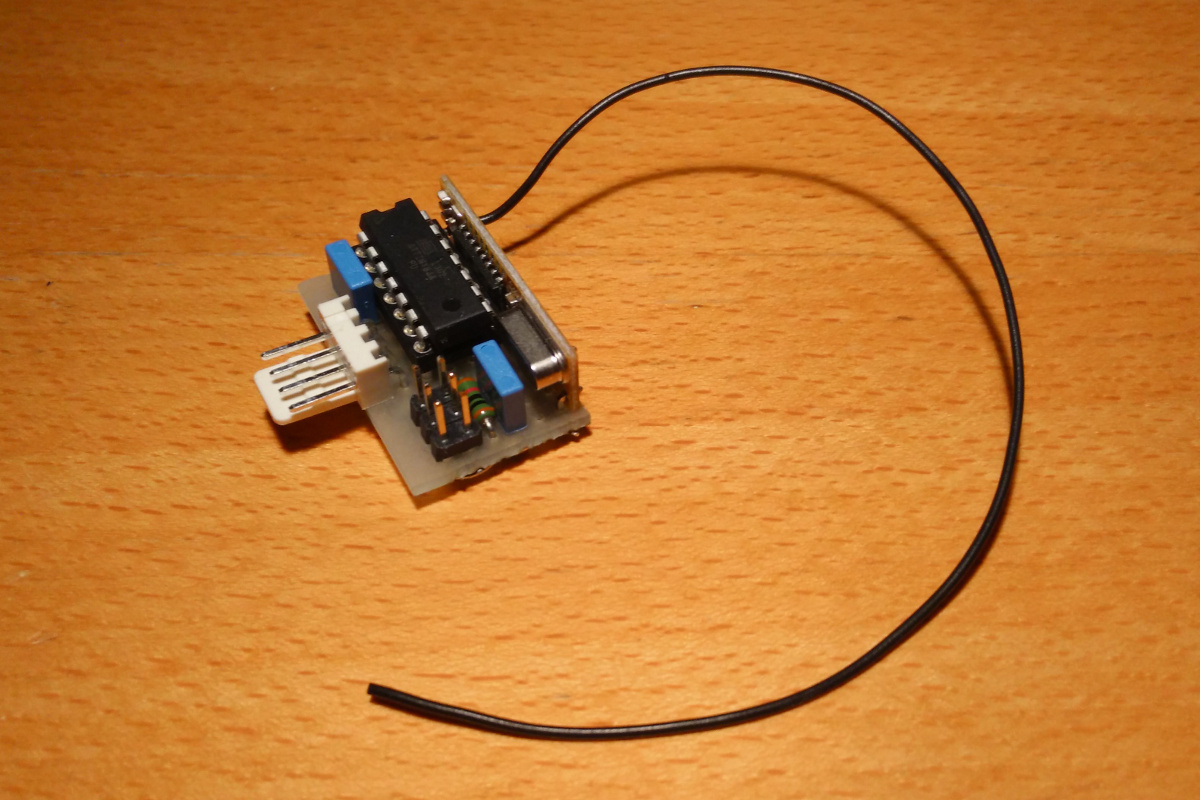
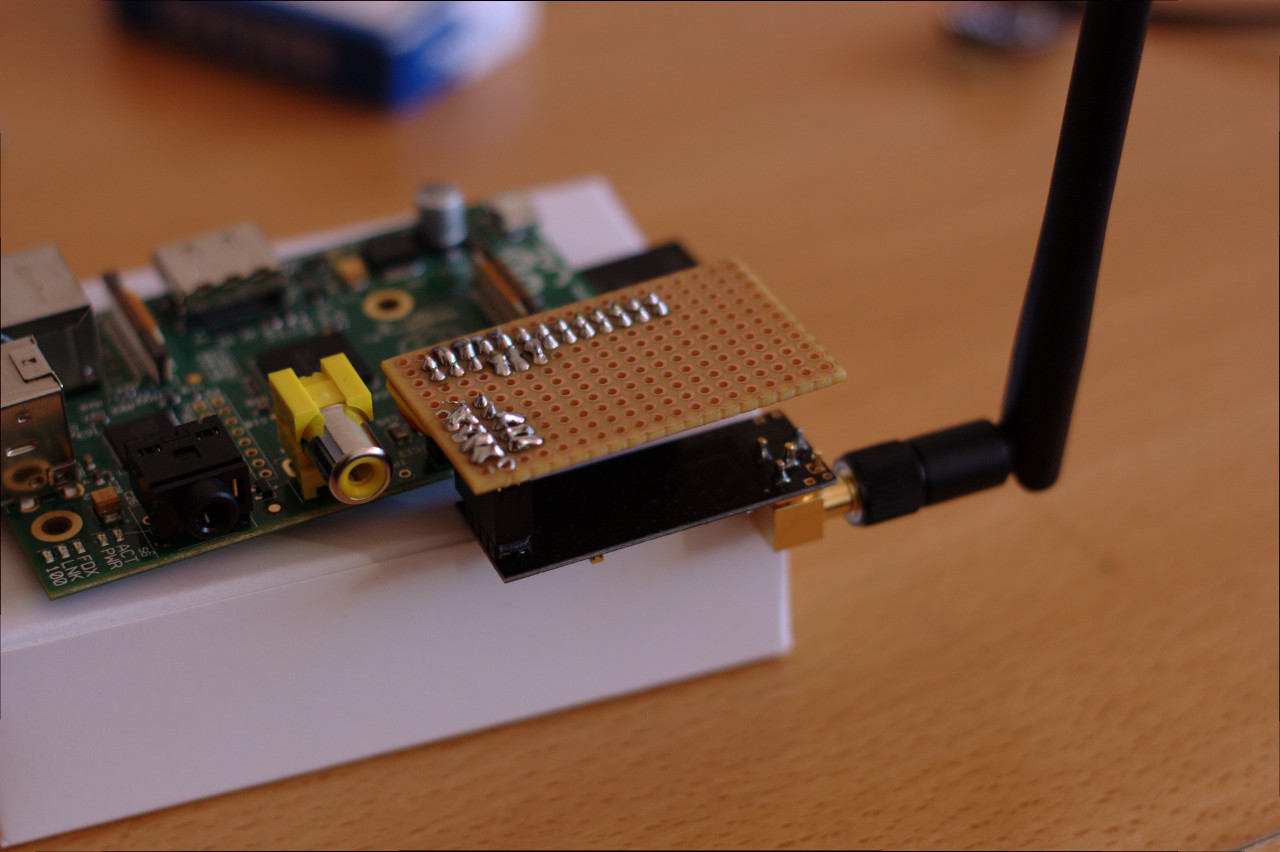
One approach would be to get the USB Infrared Toy from Seeed and record the transmitted codes directly, but instead I decided to try out a simple logic analyzer I just received in the post from China. It’s not really a logic analyzer per se, but rather a breakout board for the Cypress CY7C68013A MCU, which is the same chip as the one in the original Saleae Logic. It even enumerates as a Saleae device when I plug it in. So, basically it’s a knockoff. Naughty Chinese!
However, word on the interwebs has it that it won’t work with recent versions of the Saleae Logic software due to some minor hardware differences regarding the onboard EEPROM chip. But all this doesn’t matter, as I’ll be using the open source PulseView tool from the sigrok project instead.
Getting the codes
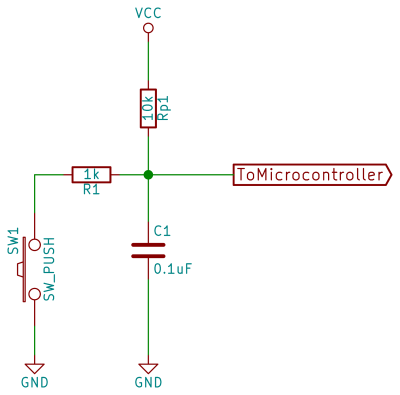
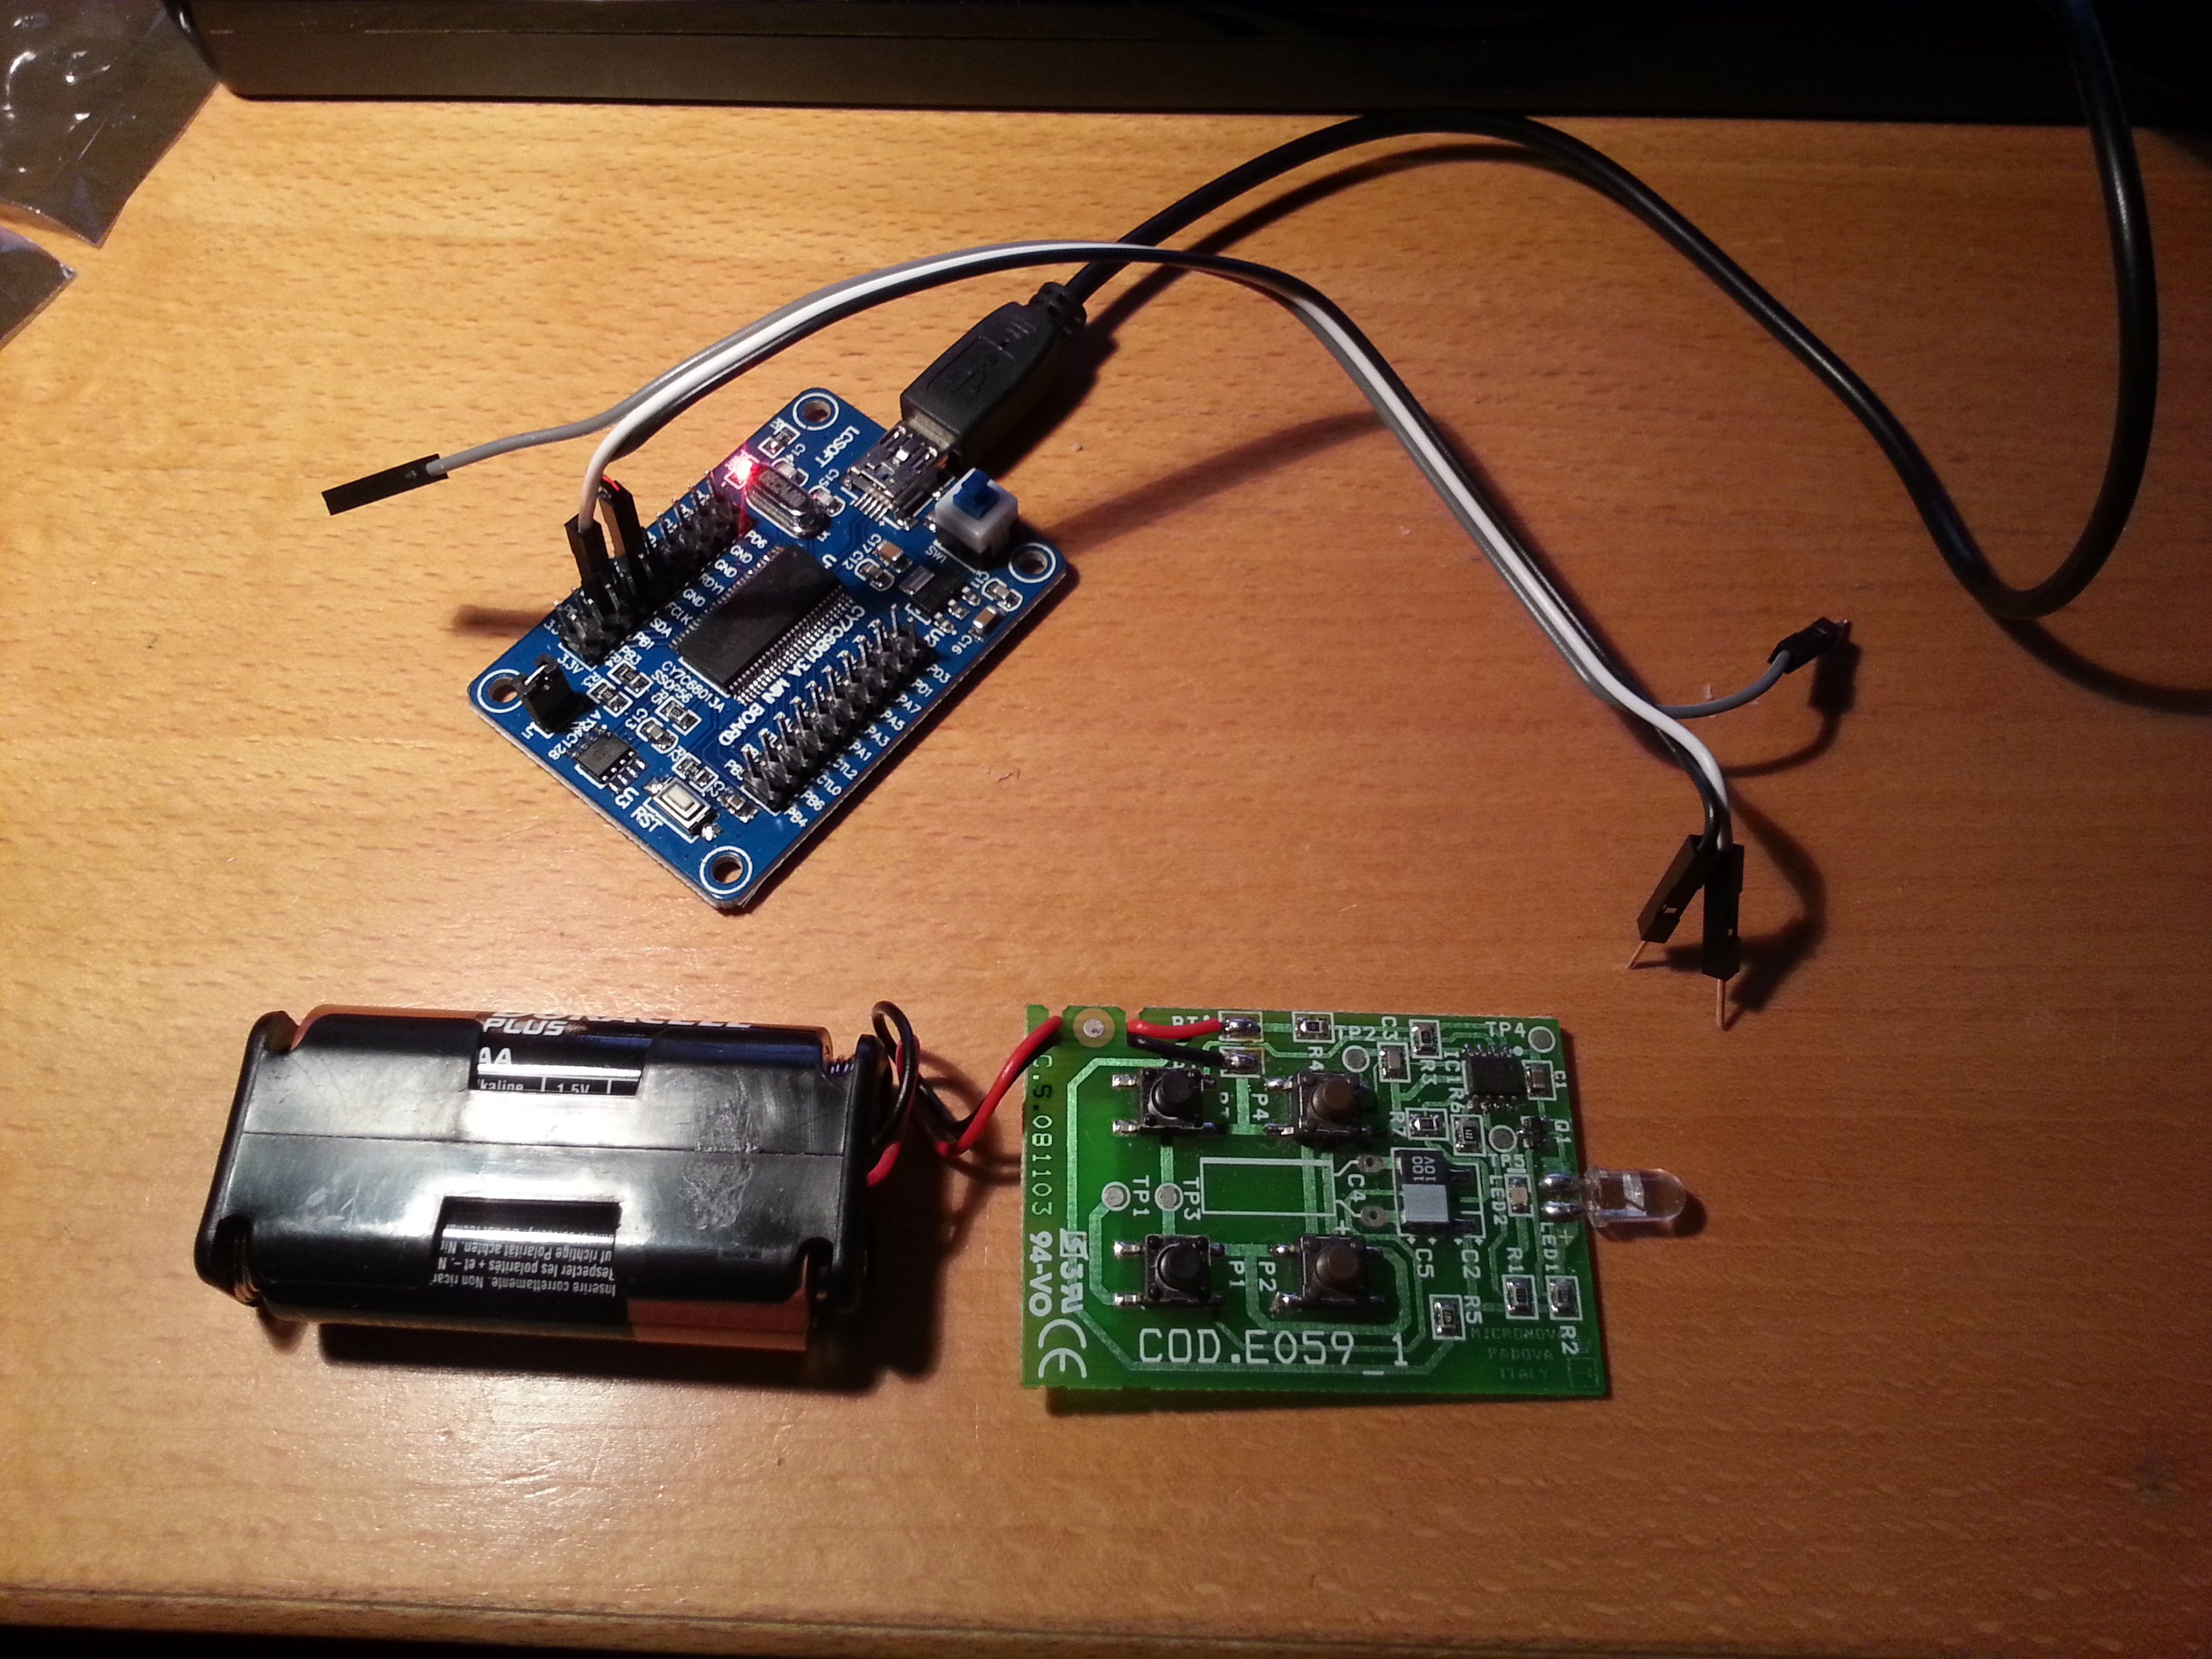
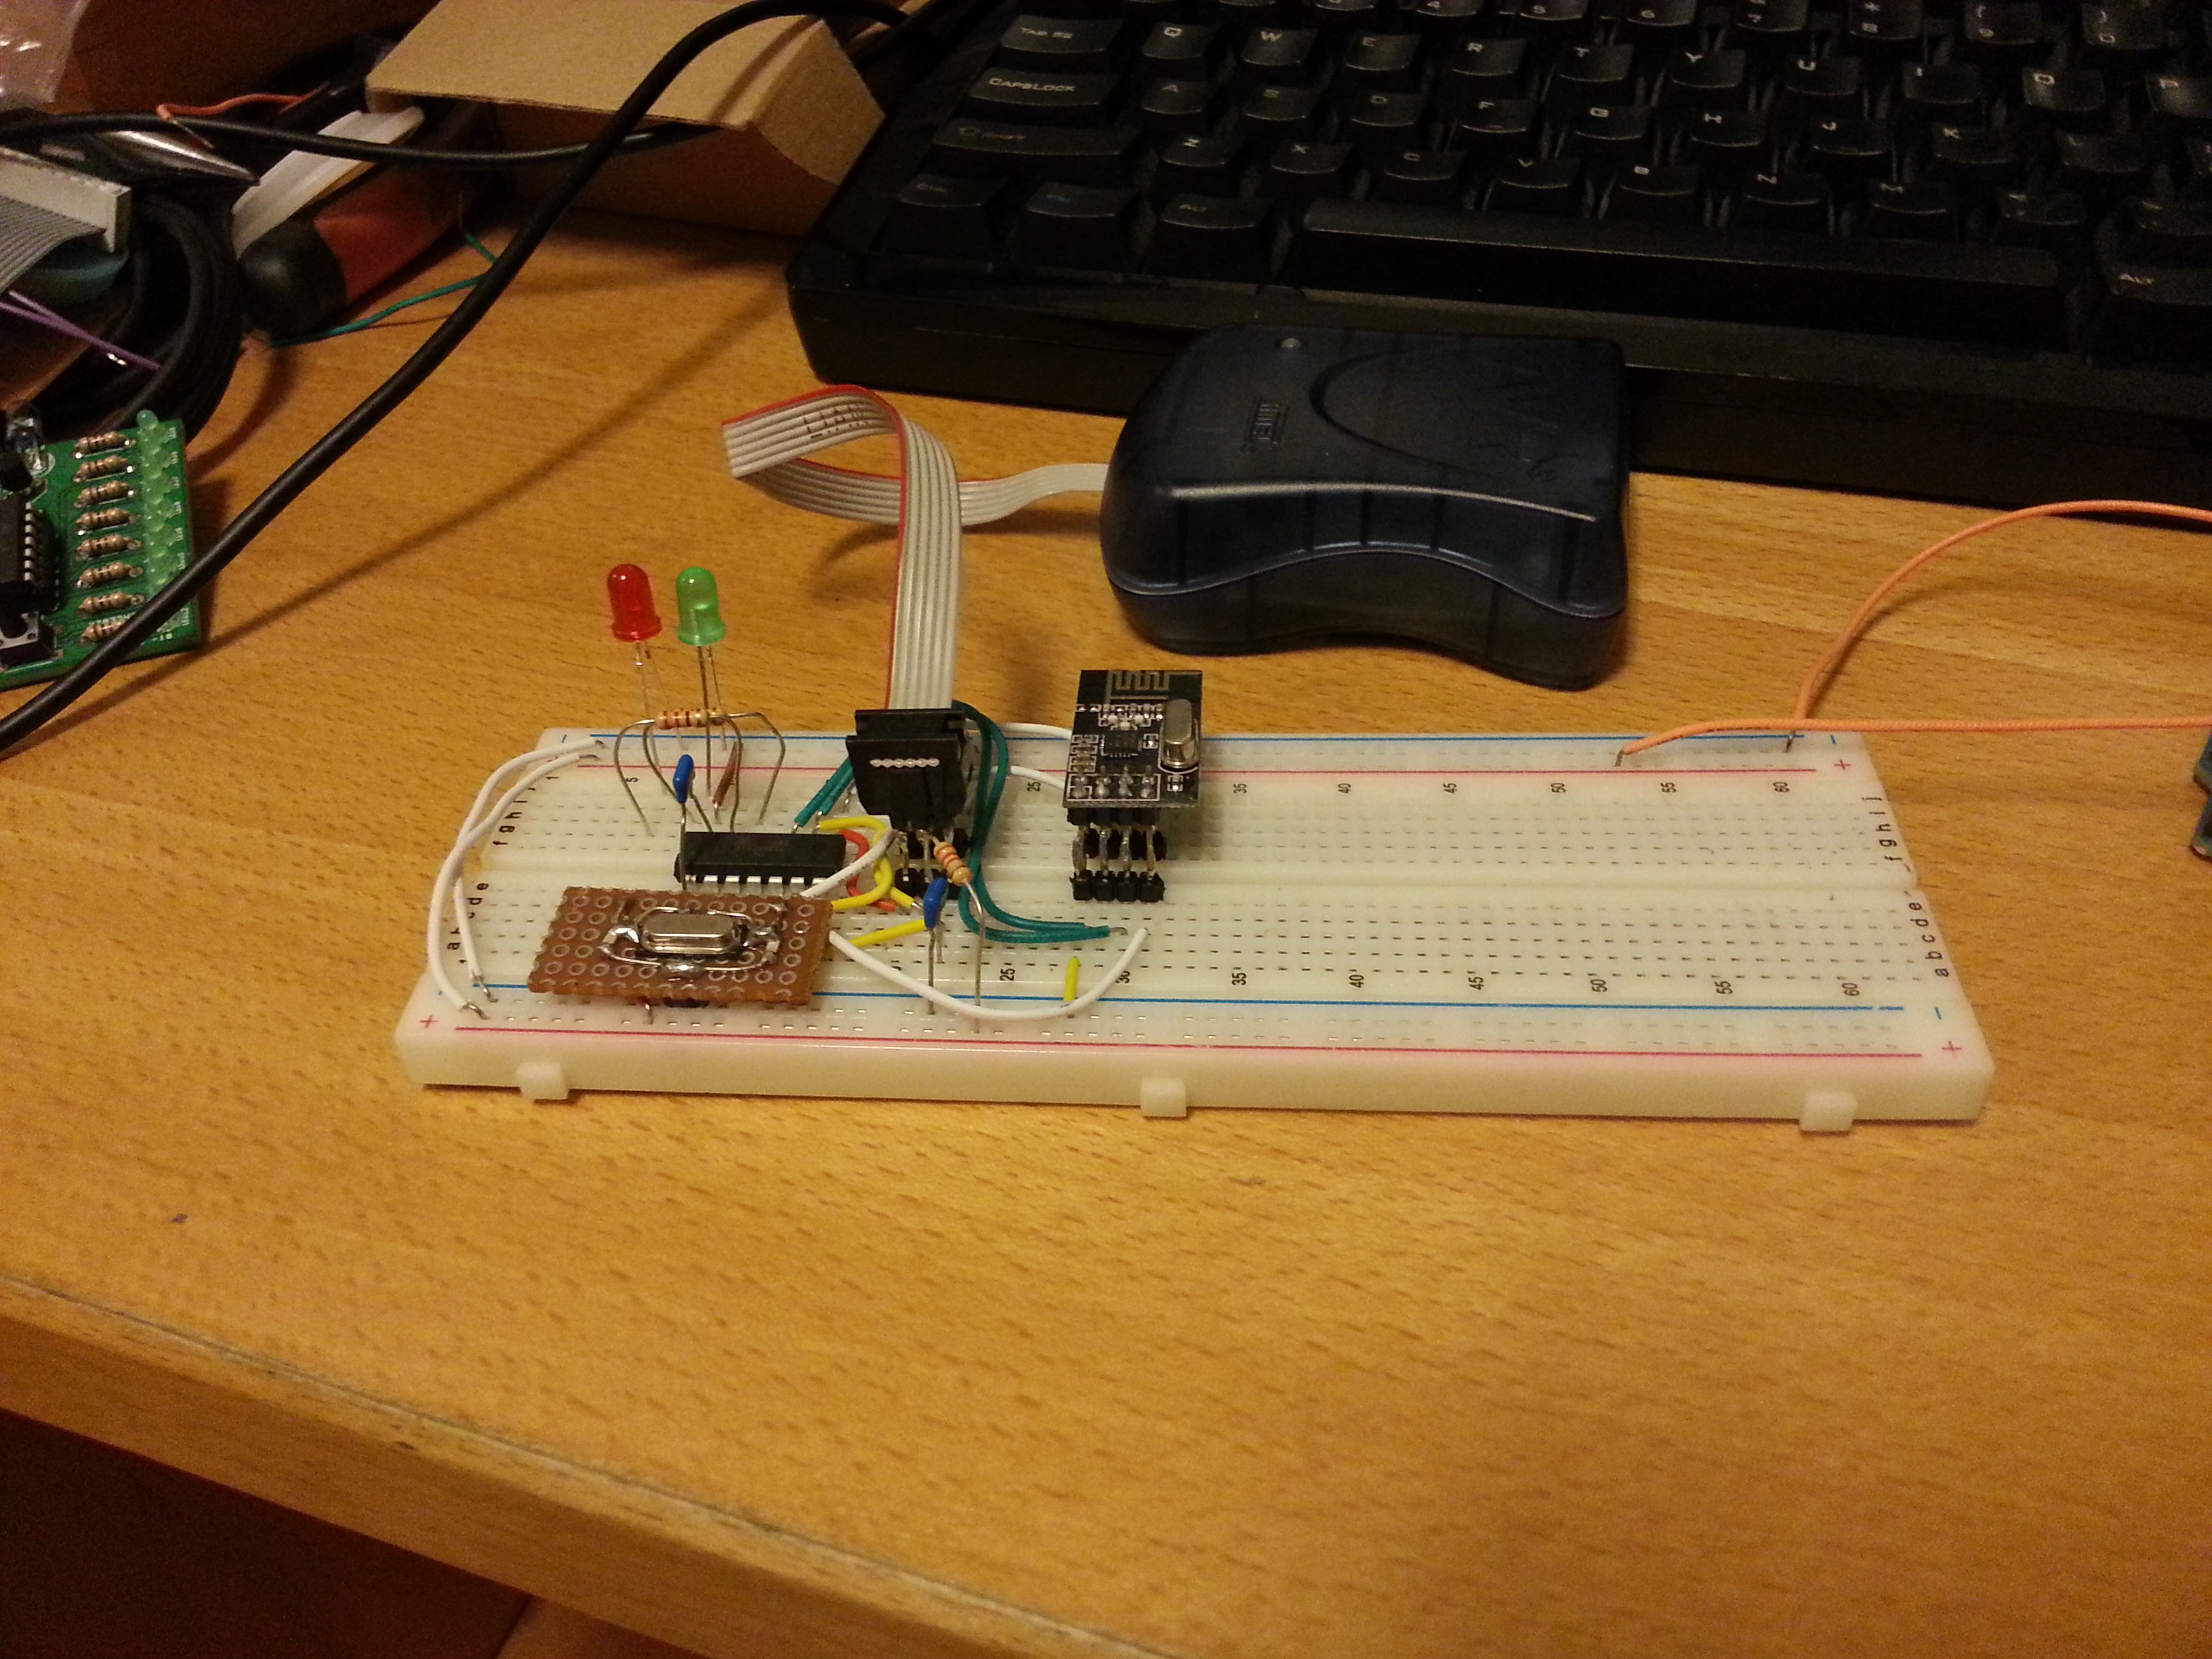
It’s not necessary to build a fancy IR receiver. Just open the remote control and attach a couple of probes across the IR LED. The voltage drop here is big enough to trigger the logic analyzer. I started the analysis by having a look at the signal itself by sampling at 24 MHz and pressing a button.

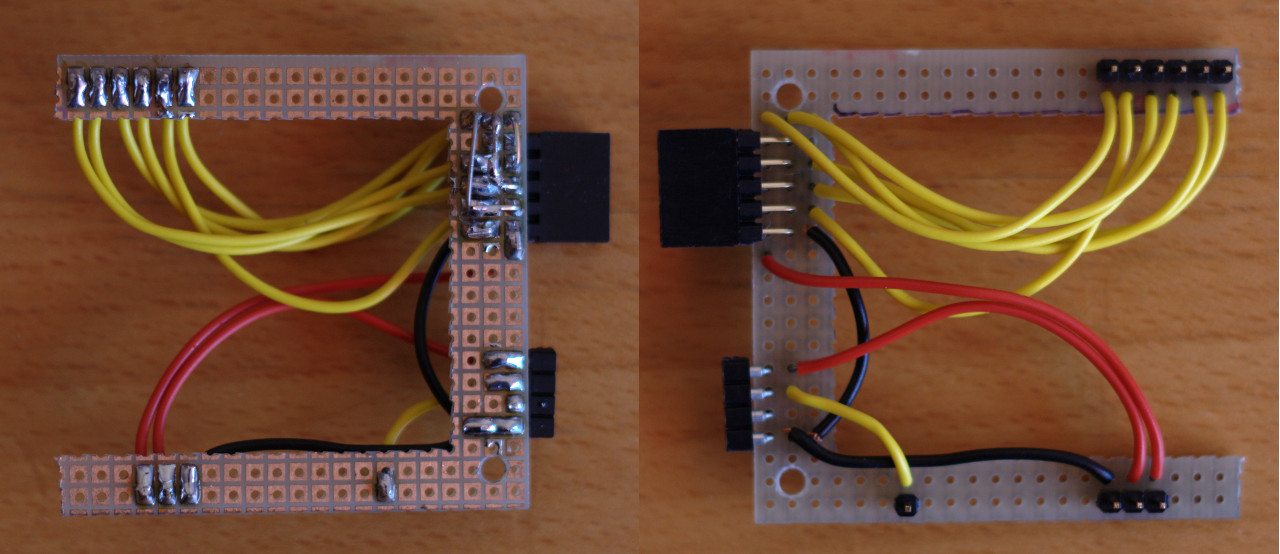
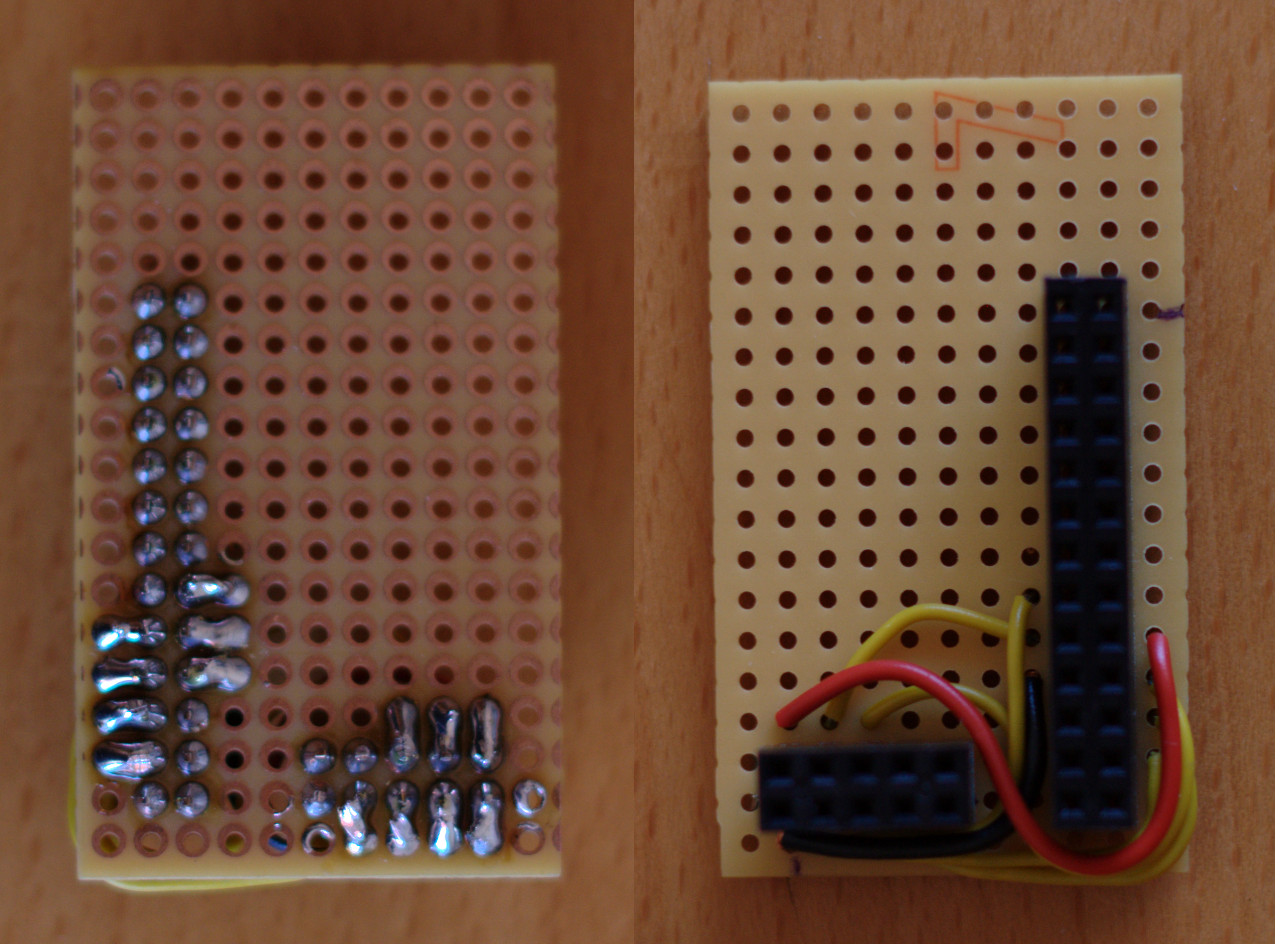
The setup
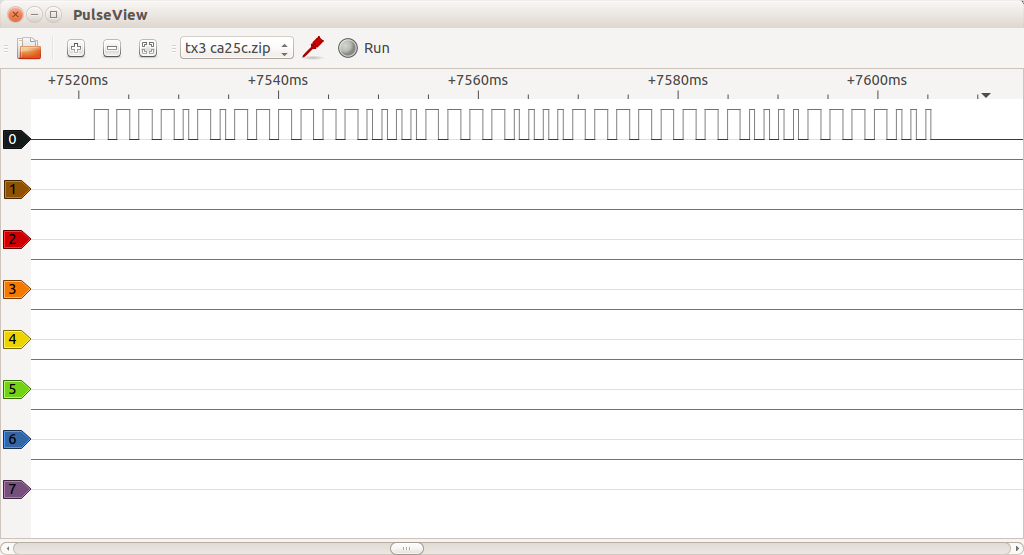
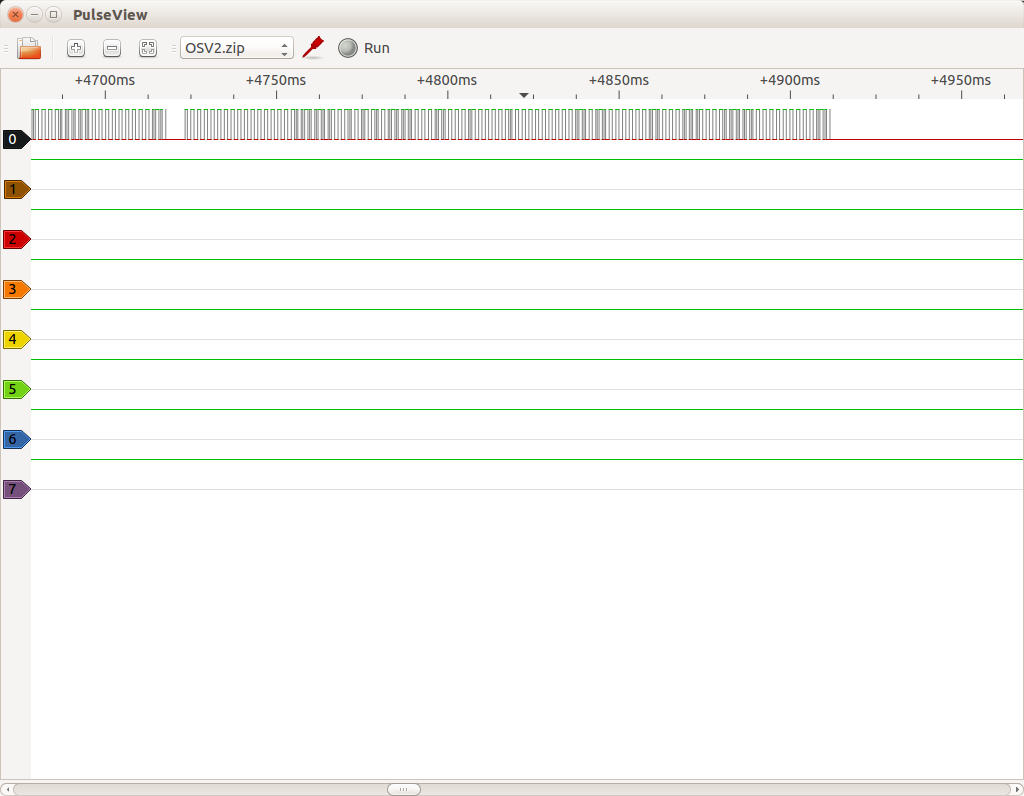
The signal consists of a series of infrared pulses, which seems to be grouped into blocks. An “on-block” is 30 pulses long. An “off-block” has no pulses, but lasts for the same duration as an “on-block”. Each individual pulse is on for 8.25 μs and off for 19.625 μs except for the last cycle of each block which is only on for 5.25 μs. The interval between the last pulse of a block and the first pulse of the next block is 28.5 μs.

29 pulses, 1 end-of-block pulse, and the beginning of the next block.
Thus a normal pulse is 27.875 μs long, which means a modulation frequency of 35874 Hz. I don’t know if the duty-cycle matters at all. Time will tell… The length of a block (incl the inter-block distance) is then: 29 * 27.875 μs + 5.25 μs + 28.5 μs = 842.125 μs.
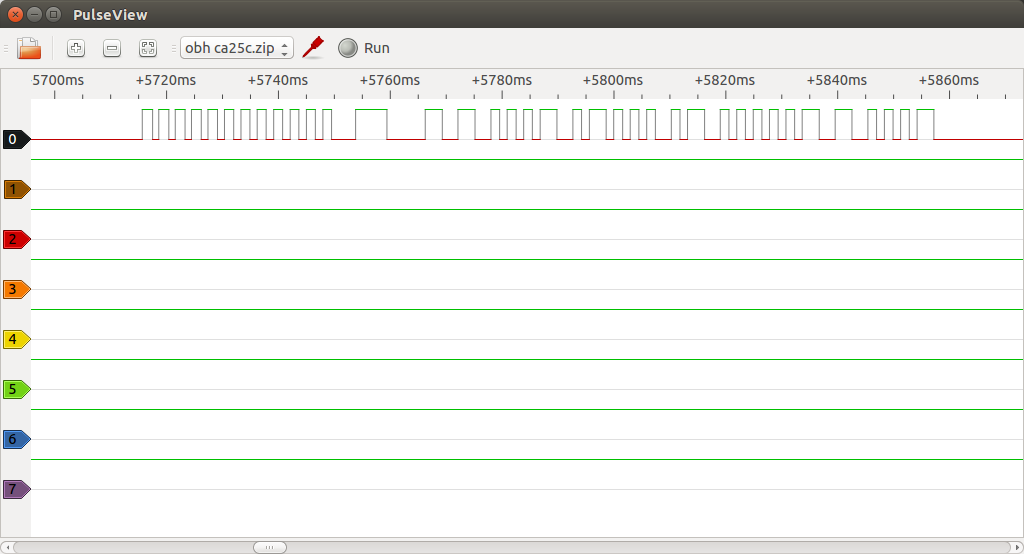
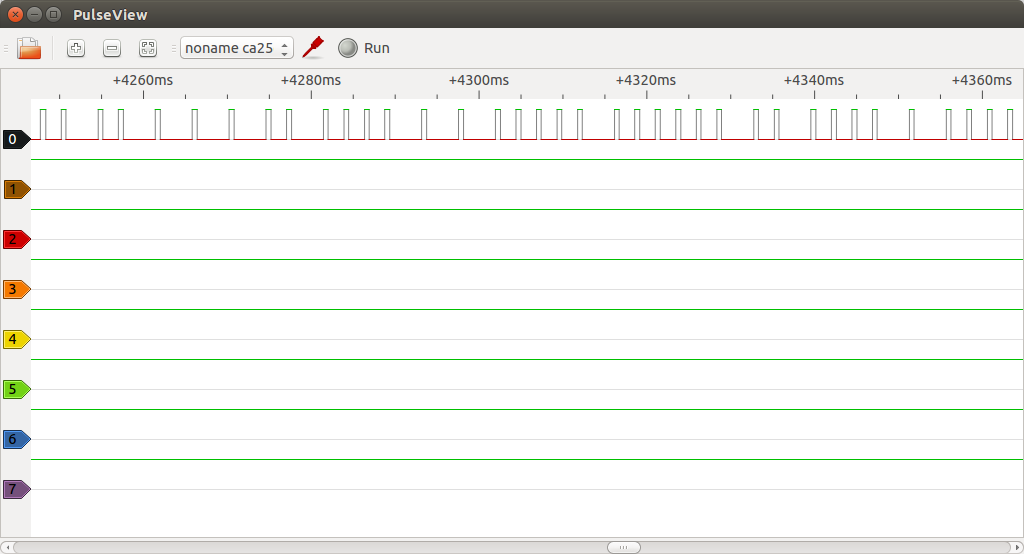
Now that we have the signal timings we can zoom out a bit. For the rest of the analysis a lower sampling rate is sufficient. In the following 1 means a high block and 0 means a low block.

A single button press
Notice how the slight inter-block delay causes the anti-aliasing to color each block a slightly different shade of gray. If we annotate the trace with 1s for on-blocks and 0s for off-blocks, we get something like this:

Annotated button press
If we do this for all 5 functions, we get these codes:
Ecoteck remote control codes
| Function | Code |
| Temperature up | 111111110001111001010011011010100110101011 |
| Temperature down | 111111110001111001010011110010100111110011 |
| Fire up | 111111110001111001010011111010100111101011 |
| Fire down | 111111110001111001010011101010100111001011 |
| On/off | 111111110001111001010011010010100110110011 |
Now we have all the necessary data we need to create a compatible remote control.
Implementing an Android app
Based on these codes, I have made a simple Android widget that should work on any phone/tablet that has an IR transmitter and runs Android 4.4.2 (API level 19). It relies on the ConsumerIrManager class that was added in that release.
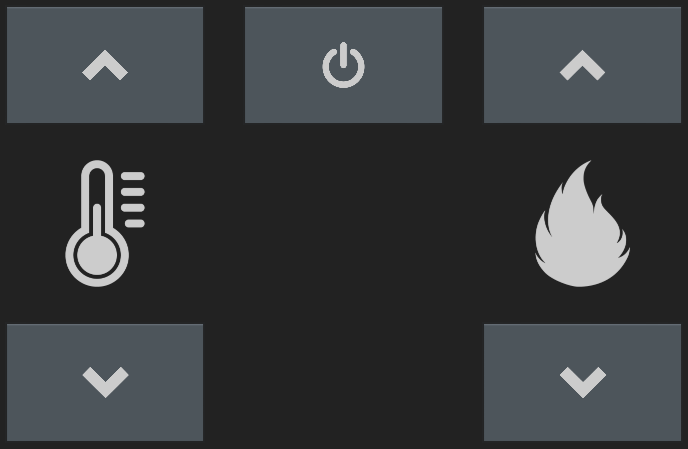
During normal operation the widget looks like this:
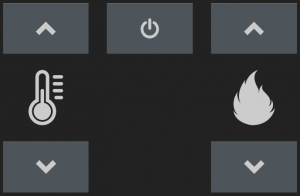
Ecoteck widget
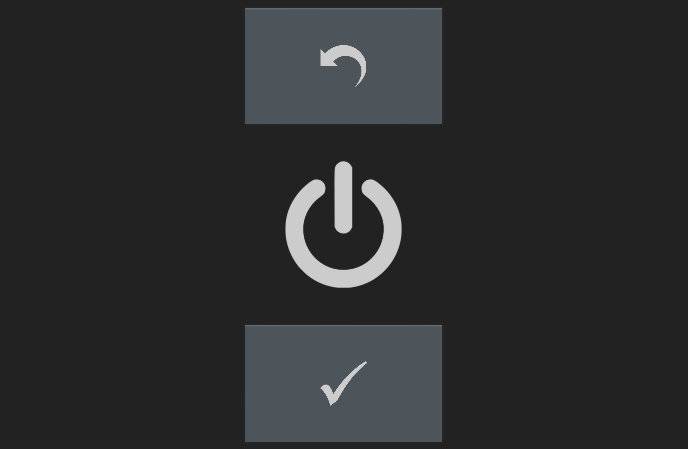
To prevent turning the stove on or off at a bad time, I originally intended the power button to be activated only if the user pressed and held it. However, in Android the long press event is reserved for doing widget management stuff and cannot be used by the widgets themselves. Bummer… Instead the widget presents the user with a confirmation dialog of sorts if the power button is pressed:
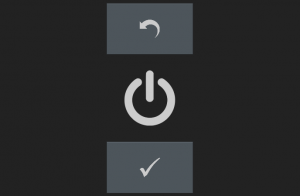
Confirm on/off command
I have been using the widget exclusively for a couple of days now and it works like a charm. 🙂
That’s it!
As usual, all code for this project can be found on GitHub. If you have any questions, please comment below.