NeoPomodorino: A Pomodoro style timer

This is a simple Pomodoro style timer I made using a Proto Shield, an Arduino clone, a NeoPixel 24 LED ring clone, and various bits and pieces from my parts drawer.

The NeoPomodorino in action

The NeoPomodorino in action

The single button is wired to pin 3 of the Arduino using a simple RC debounce circuit featured some time ago on Hackaday. It’s probably not needed, but what the hell.

Debounce circuit

Debounce circuit

The LED ring is wired to pin 6 (like it is in every NeoPixel code example I’ve seen so far). As suggested a few places, I have a 470 ohm resistor in series with the data pin, and a electrolytic capacitor across VCC and GND. Like the debounce circuit, these are also probably not needed.

Usage

  • Long button presses (> 500ms) will turn the device on and off. This also resets the timer.
  • Short button presses will add 1 minute to the current timer.
  • Each pomodoro consists of 25 minutes of work (red color) followed by a short 5 minute pause (yellow color).
  • Every fourth pause is a longer one of 25 minutes (green color).
  • Between each pomodoro, the device will briefly flash which number is (blue color). 1 quarter of the ring = 1 pomodoro.

Get the code on GitHub.

Happy Hacking! 🙂

RPIWeather: Adding off-the-shelf wireless sensors

So, the last couple of years I have been developing and using my own home-built wireless thermometer/hygrometer system called RPIWeather (which is open source). Then the other day I discovered that the previous owners of our house (my in-laws) had left a few items outside. To be more precise, they left a couple of wireless thermometer sensors from old weather stations. The weather stations are long gone by now and, needless to say, the batteries were quite dead. But that doesn’t mean the devices themselves don’t work. Hmm.. It might even be possible to add these into my own system. I always like a good challenge…

Let’s have a look…

Three wireless thermometers

Three wireless thermometers

The devices all looked a bit gnarly, but after a bit of clean-up I powered them on one by one and had a look using my RTL-SDR receiver. All three devices worked and transmitted on 433MHz. Yay! But as my RPIWeather base station only supported the nRF24L01 2.4GHz transceivers, I had to make and add a new 433MHz receiver to it.

Setting up a prototype receiver

At first I toyed with the idea of simply adding an RTL USB-dongle to my Raspberry Pi and simply use GNU Radio (or some other SDR framework) to receive the signals. But that seemed a bit overkill. And I’m not even sure a first generation Raspberry Pi is powerful enough for this to work properly. Fortunately, the usual Chinese Ebay sellers offer a few different generic 433MHZ ASK/OOK receiver modules.

RXB12

RXB12

I ended up choosing one called RXB12 which features a Synoxo SYN470R IC. It’s reasonably sensitive across the 433MHz spectrum, but doesn’t offer any I/O besides a continuous stream of binary data (which is just random noise most of the time).

The rest of the prototype was an Arduino Uno, but any old Arduino will do.

The protocols

In parallel with my prototype Arduino setup, I also hooked up my logic analyzer (a cheap Cypress-based Saleae Logic clone) to eavesdrop on the serial data stream from the radio chip.

OBH

OBH unit

OBH unit

The protocol appears to be the one known as “Oregon Scientific V1”, which is a somewhat old protocol exclusively used for temperature-only sensors.

Signal sample

Signal sample

Europe Supplies Ltd. TX3

TX3 unit

TX3 unit

Once you realize that this is identical to a LaCrosse TX3, you are done. This is a very popular sensor and its protocol is quite well known. It is unfortunately not the TX3-TH variety that also reports relative humidity, but at this price (free) I’ll take it.

Signal Sample

Signal Sample

Unbranded unit

Unbranded unit

Unbranded unit

The protocol used by this unit is a bit different. At first glance it looks like identical short bursts until one looks at the intervals between the bursts. Short intervals mean 0 and long intervals mean 1. The unit sends 36 bits 7 times. My Google-fu didn’t find a lot of information about this one, but apparently the protocol seems to be very similar to the ones used by other unbranded china-devices. The so-called checksum used by this device is somewhere between useless and batshit insane.. Have a look in the code for the dirty details.

Signal sample

Signal sample

Bonus: Weber Style wireless BBQ thermometer (Model AW129)

Weber AW129

Weber AW129

Interestingly enough, this is just a rebranded Oregon Scientific unit that (unsurprisingly) uses the so-called “Oregon Scientific V2” protocol. To ensure data integrity, the signal is sent twice and each instance includes both a nibble checksum and a byte CRC8.

Signal sample

Signal sample

Having a wireless BBQ thermometer with data logging is actually very useful when doing slow-food like pulled pork where the smoker has to be monitored regularly over a period of several hours. It’s suddenly very easy to pick up on small changes in the rate of temperature increase inside the meat. This enables very fine-grained control of the air vents in the smoker as well as an indication if more coal or water is needed. Finally, it allows me to accurately predict several hours in advance when the meat will be done.

Pulled pork

Pulled pork

I have no idea why a relatively nice wireless thermometer like this one is shipped with such a crappy receiver. Main problems include:

  • There is no way of setting user-defined temperature alarms. The unit is shipped with a small number of factory presets depending on the type of meat and doneness, but the selection is extremely limited.
  • The transmitter sends quite accurate readings with a resolution of 0.1 degrees Celcius, but the receiver unit just rounds this number to the nearest integer. This may be OK for most use-cases, but it’s very annoying for me when I want to keep a close watch on things.
  • Sound alarms cannot be changed/muted.

But at least I’m happy that I can make my own receiver this way. 🙂

Porting to the ATtiny84 and adding 433MHz capability to RPIWeather

I had a few DIP ATtiny84s left over from the prototype phase of my own sensor nodes. Using one of these I was able to make a sufficiently compact module that listens for these known data packets on 433MHz and then forwards them to my Raspberry Pi using its internal UART RX pin. For this to work, I had to stop Linux from using the internal UART pins for a serial console interface. But it was a small price to pay, I think.

433MHz receiver

433MHz receiver

Originally, RPIWeather was designed exclusively with my own sensor nodes in mind. It actually triggered a bit of much needed refactoring to add this new capability to the code. Now the script starts a thread for the InfluxDB sender as well as a thread for each data source. These threads run totally independently and are only communicating through a concurrent queue object. At this point in time, RPIWeather supports three data sources which are connected to the Raspberry Pi in three different ways:

  1. My own 2.4GHz sensor nodes. The receiver is connected to the internal SPI pins.
  2. The above-mentioned 433MHz thermometer sensors. The receiver is connected to the internal UART RX pin.
  3. A Bosch BMP180 barometric sensor for measuring atmospheric pressure. It is connected to the internal I2C pins.

Show me the code!

All code and schematics can, as usual, be found on GitHub.

Happy Hacking! 🙂

RPIWeather: My wireless monitoring system

Some of the first posts on this blog were about how to interact with the famous nRF24L01 2.4GHz radio chipset from both an Arduino and a Raspberry Pi. Well.. Much have happened in the mean time, but at least I have managed to put together something using what I learned back then. I decided to make a wireless monitoring system for environmental data in and around our house with at least one sensor node in each room as well as a couple of sensors outside. It is called RPIWeather and you can get all the code and documentation by clicking the name. This post is just meant as a short summary.

RPIWeather consists of a bunch of wireless sensor nodes, a base station that collects the data packets, a database server, and one or more frontends. My goal has been to collect data at 5 minute intervals and keep it indefinitely for analysis, comparison, and visualization. This creates some demands for power efficiency and reliability, which I find interesting.

The sensor nodes

My first prototype was based around an Arduino and some proto-board and is described here, here, and here. It looked like this:

Arduino with nRF24L01 and DHT22

Arduino with nRF24L01 and DHT22

To keep things simple, clean, and small, I decided to ditch the Arduino platform and code in straight avr-libc for the ATtiny84 chip from Atmel. So I made another prototype, but this time with an ATtiny84 instead.

Partial prototype without the DHT22 sensor

Partial prototype without the DHT22 sensor

Little by little a schematic emerged. Besides the radio, the sensor and the MCU, I also needed some sort of power supply. As the sensor nodes are to be distributed throughout the house, this implied battery power, but it couldn’t just be any old battery. The thing is that the radio chip can only tolerate up to 3.6v and the DHT22 sensor can only operate down to ~3v, which leaves a narrow band of usable voltages. A traditional voltage regulator would have burned though the batteries quite quickly, so I had to put in a switching boost converter. This way 2 AA NiMH batteries can deliver a reasonably stable 3.3v supply voltage for the circuit. Pro tip: when buying NiMH batteries, do yourself a favor and use the low self-discharge kind like Eneloop. In this use-case they will go for several months between charges.

Schematic for the sensor nodes

Schematic for the sensor nodes

With the schematic in place, I made a PCB layout and sent it to ITEAD for manufacturing. Here are a couple of pictures showing various stages of assembly. The funny shape of the boards was needed to make them fit snugly into some cool boxes from New Age Enclosures.

Sensor node PCBs

Sensor node PCBs

The first 10 finished boards

The first 10 finished boards

Inside a single sensor node

Inside a single sensor node

A single sensor node

A single sensor node

The back of a sensor node

The back of a sensor node

The 10 first sensor nodes

The 10 first sensor nodes

In addition to the DHT22 sensors, I have also made firmware for collecting data from a wind vane and a rain gauge. But I haven’t deployed any of that yet. Maybe next spring…

All in all the main results for the sensors are:

  • They work! I have tested concurrent operation of 10 units without major problems.
  • Firmware optimized for ATtiny84 @ 1 MHz (8MHz crystal with the CKDV8 fuse set)
  • Temperature and humidity measurement using a DHT22 sensor
  • Wind speed and wind direction measurement using a La Crosse TX23 anemometer
  • Rainfall measurement using a WS-2300-16 rain gauge
  • Wireless operation using the very popular nRF24L01+ 2.4 GHz radio chip
  • Very compact CRC32 implementation
  • Battery powered operation using a very efficient 3.3v DC/DC converter
  • Power management by sleeping the CPU and turning off unneeded hardware
  • Battery voltage measurement included in data packet
  • Typical battery draw while sleeping has been measured to around 17uA
  • Total firmware size from 3.0 kiB to 3.5 kiB (depending on sensor type)

The base station

I use a Raspberry Pi as base station. To make it more appliance-like than a typical Raspbian installation, I have instead installed a variant of Tiny Core Linux called piCore. This is basically a very small Linux distribution that loads all programs into memory on boot and leaves the SD card alone after this. This eliminates the usual risk of corrupting the file system when doing a power-cycle.

On the base station I have installed a small python script that continually polls the nRF24L01 radio using the Raspberry Pi’s built-in SPI interface pins. When a data packet arrives, it is buffered (in case of network problems) and forwarded to the database.

The database

With my limited data requirements, I could probably use any old database out there without issues. However, given the nature of the data, it was natural to select a so-called timeseries database. For this project I chose InfluxDB, which was very, very easy to set up on my Ubuntu-based file server. It automatically exposes a simple HTTP interface for storing and querying data, which is just what I need for this project.

The frontend(s)

Well, I’m not quite there yet… So far the only frontend is the admin interface that is built in to InfluxDB. Not very user friendly (not to mention the Wife Acceptance Factor)! The next step now is to make some sort of nice frontend for this. I have several ideas floating around my head:

  • An intranet website. The easiest way.
  • An Android widget. Both the wife and I have Android smartphones.
  • Dedicated hardware devices. This would be a great use-case for my new ESP8266 wifi modules and some 84×48 Nokia LCDs I have lying around.

Stay tuned…

Tech Talk Tuesday Timer

So, we love to have very technical talks at Open Space Aarhus, our Friendly Local Hackerspace. In fact we love it so much that the first Tuesday every month we host an event called Tech Talk Tuesday, or T³. The general idea is that the board members take turns scheduling a handful of short 15…30 minute talks. But as much as we like to hear nerds drone on about nerdy stuff for hours, we like it even better when they stick to the time plan. Therefore, I decided to make some sort of countdown-timer. At Open Space Aarhus we really like tautograms for some reason, so the name of this contraption was a no-brainer: Tech Talk Tuesday Timer, or T⁴.

Features

A normal person would just find some normal off-the-shelf solution and get on with it, but what fun is that? Projects like this tend to be more fun when you make some self-imposed restrictions. Let’s start with some quite reasonable ones:

  • All hardware must be sourced from within Open Space Aarhus.
  • The timer must be wirelessly remote controllable.
  • The display must be big enough to be clearly visible by all attendees.
  • Any third-party software must be free (as in free beer), preferably open source.
  • All visual design must comply with OSAA’s design guidelines.

My starting point was therefore an off-the-old-crap-shelf-at-OSAA solution consisting of an old craptop running Linux and an ancient ATI Remote Wonder remote control. This setup easily satisfies the first four restrictions. The fifth is also not really a problem. A few more restrictions were added to make it interesting:

  • The timer must be implemented as a single self-contained SVG file. All tricks are allowed, but it must remain a valid SVG file.
  • The timer must work out-of-the-box on a fresh install of any recent Linux distribution with only minimal setup. It is allowed to install a browser of choice and whatever software needed for the remote control.

The result

In the end I succeeded making a valid SVG file with an embedded OpenType font (as per the design guidelines), some embedded sound effects, and a remote controllable user interface. The SVG works in all major web browsers. Microsoft Internet Explorer is not a major web browser.

Tech Talk Tuesday Timer

Tech Talk Tuesday Timer

You can get the code on GitHub or try it out online.

Usage

The timer has several states, each with its own user interface. Any input device that can act as a keyboard is usable for this.

Logo Screen

  • Press ‘B’ to go to Wallclock Mode.
  • Press ‘D’ to go to the Configuration Screen.

Configuration Screen

  • Press 0..9 and the arrow keys to set the time.
  • Press ‘D’ to start the timer
  • Press ‘C’ to go to the Logo Screen

Running Timer

  • Press ‘D’ to pause the timer.
  • Press ‘C’ to cancel the timer.
  • When there’s 5 minutes left, a warning sound is played.
  • When time’s up, the alarm goes off.

Paused Timer

  • Press ‘D’ to resume the countdown.
  • Press ‘C’ to cancel the timer.

Wallclock Mode

  • Press ‘C’ to go back to the Logo Screen.


What does a TrueType font look like on the inside? And how do you make one? (Part II)

In this post, I’m going to discuss a simple bitmap vectorization algorithm that’s compatible with TrueType. The goal is to convert a C64 character set to a usable TrueType font.

Most technical details about TrueType and character mapping (i.e. C64 character sets vs. PETSCII vs. ASCII vs. Unicode) can wait for the upcoming blog posts. However, there are already a few facts about C64 characters and TrueType we do have to keep in mind. These are:

  • Each C64 character glyph is 8×8 pixels, monochromatic, and monospaced. Because they are monospaced, we don’t have to concern ourselves with issues like kerning.
  • TrueType only has limited support for bitmap fonts. Therefore, we need to vectorize the 8×8 bitmaps. No need for fancy bezier curves. Just crisp retro-looking blocks with 90-degree corners.
  • A TrueType-style glyph in its most basic form (without hinting) consists of a set of contours, and a contour consists of a set of points. Points in opaque contours are specified in clock-wise order and points in transparent contours (e.g. the “hole” in the letter O) are specified in counter-clockwise order.
  • Some letters go a bit below the baseline. The vertical range above the baseline is called the ascent and the range below is called the descent. Most C64 character sets seem to have an ascent of 7 pixels and a descent of 1 pixel.
  • Coordinates in a TrueType glyph are normally scaled such that the glyph will fit inside a 2048×2048 box. If the font has a non-zero descent specified, the Y-coordinate will be negative below the baseline. Assume a typical 8×8 pixel C64 character with a 1 pixel descent. In TrueType-terms each pixel would then be 256 units by 256 units, the lower left corner would be at (0, -256), and the upper right corner would be at (2048, 1792).
  • A contour should consist of as few points as possible in order to reduce complexity. Consecutive points along an axis can be simplified to include only the endpoints without any differences in the rendering of the glyph. Also, the last edge in a contour is implicit. The renderer will simply assume a direct line from the last point back to the first.

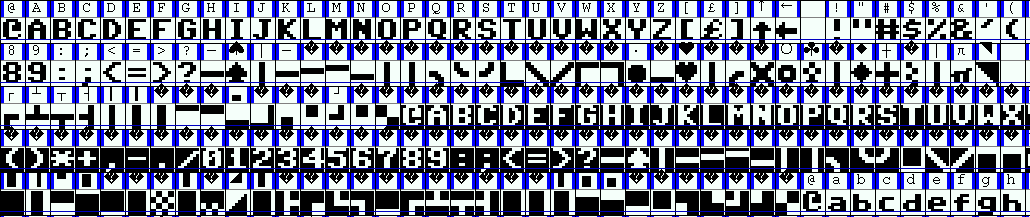
This ought to be enough for now. Let’s now try to convert the default C64 ‘A’-glyph to a TrueType-compatible vectorized form. In ASCII ‘A’ is char #65, but on a C64 in upper-case mode the character set is laid out as follows. In this mode there are 128 characters in both their regular form as well as an reverse video version:

Dump of C64 character generator data (upper-case mode)

Dump of C64 character data (upper-case mode)

Each character consists of 8 bytes that each describe a row of 8 bits. The top left pixel of a given character is the most significant bit in the first byte and the bottom right pixel is the least significant bit in the 8th byte. Let’s look at the first 24 bytes of this data:

0x3C, 0x66, 0x6E, 0x6E, 0x60, 0x62, 0x3C, 0x00, 0x18, 0x3C, 0x66, 0x7E, 0x66,  0x66, 0x66, 0x00, 0x7C, 0x66, 0x66, 0x7C, 0x66, 0x66, 0x7C, 0x00

We are interested in the second character, which is at bytes 0x08…0x0F. If we try to show these as binary with one number per line, we get something like this:

0x08: 0x18 = 0b00011000
0x09: 0x3C = 0b00111100
0x0A: 0x66 = 0b01100110
0x0B: 0x7E = 0b01111110
0x0C: 0x66 = 0b01100110
0x0D: 0x66 = 0b01100110
0x0E: 0x66 = 0b01100110
0x0F: 0x00 = 0b00000000

Or, a bit more clear like this:

The letter 'A' on a C64.

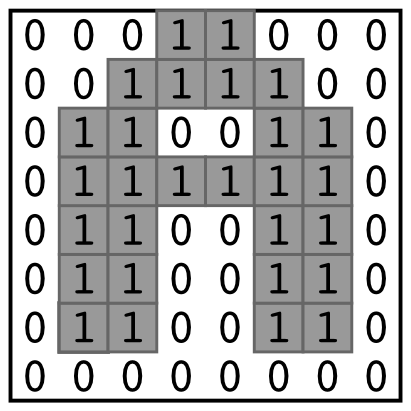
The letter ‘A’ on a C64.

This looks like the letter ‘A’. Notice that it doesn’t go below the baseline (i.e. the lower-most row consists entirely of zeroes). But how do we make this into some nice vector contours? An easy way to vectorize a bitmap like this is to simply draw a clockwise box around each opaque pixel. This, however, is very wasteful:

Naive vectorization

We are already getting close. Notice how all edges on the outside are going in a clockwise direction around the letter, and how the edges in the “hole” are going counter-clockwise. This is exactly what we want. But we only want edges on the boundary of the contours. In the picture above we have 28 opaque pixels with 4 edges each, resulting in 112 edges in total. That’s a bit too much. Let’s change the algorithm to skip all edges where the adjacent pixel is opaque. Then it looks something like this:

Unncessary edges removed

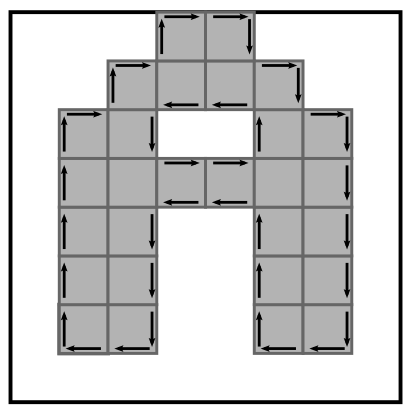
Unncessary edges removed (well, most of them..)

Now we are down to 38 edges. But we can do better. Quite a few edges are consecutive along an axis. These can be merged to yield simpler contours.
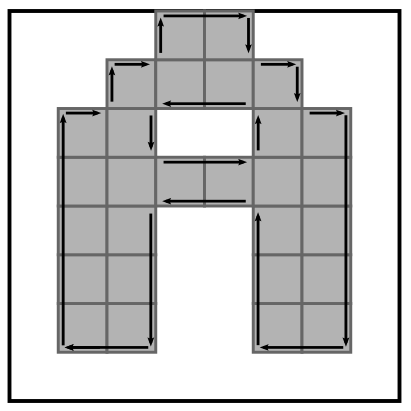
Almost there...

Almost there…

Now we are down to 20 edges with 16 in the outer clockwise contour and 4 in the inner counter-clockwise contour. Now we only have to scale the coordinates of the edges to fit a TrueType glyph. Remember that everything is supposed to fit within 2048×2048 units, giving a pixel size of 256×256. Then we are done:
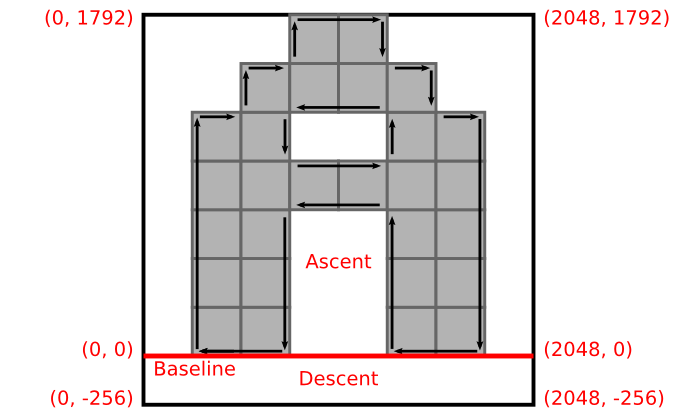
Vectorization done!

Vectorization done!

In the TTX format of FontTools, this would look something like the following:

<TTGlyph name="A" xMin="256" yMin="0" xMax="1792" yMax="1792">
  <contour>
    <pt x="256" y="0" on="1"/>
    <pt x="256" y="1280" on="1"/>
    <pt x="512" y="1280" on="1"/>
    <pt x="512" y="1536" on="1"/>
    <pt x="768" y="1536" on="1"/>
    <pt x="768" y="1792" on="1"/>
    <pt x="1280" y="1792" on="1"/>
    <pt x="1280" y="1536" on="1"/>
    <pt x="1536" y="1536" on="1"/>
    <pt x="1536" y="1280" on="1"/>
    <pt x="1792" y="1280" on="1"/>
    <pt x="1792" y="0" on="1"/>
    <pt x="1280" y="0" on="1"/>
    <pt x="1280" y="768" on="1"/>
    <pt x="768" y="768" on="1"/>
    <pt x="768" y="0" on="1"/>
  </contour>
  <contour>
    <pt x="768" y="1024" on="1"/>
    <pt x="1280" y="1024" on="1"/>
    <pt x="1280" y="1280" on="1"/>
    <pt x="768" y="1280" on="1"/>
  </contour>
  <instructions><assembly>
    </assembly></instructions>
</TTGlyph>

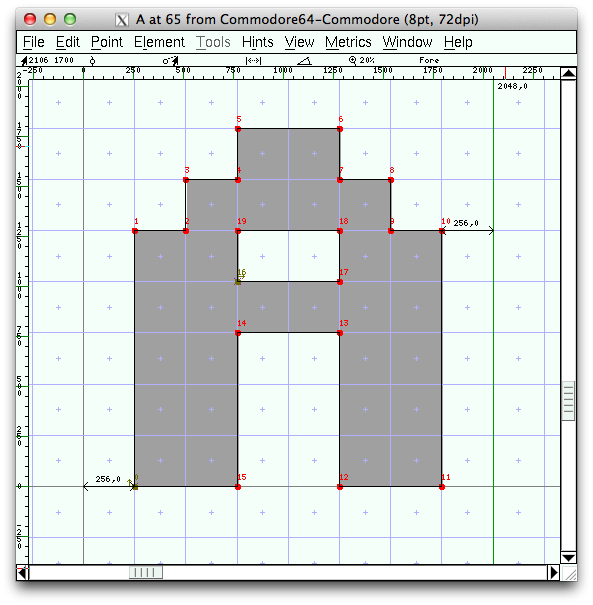
Finally, let me give you a sneak peek of what this character looks like in the TrueType font editor FontForge:

Screenshot of FontForge

Please have a look at the complete C64 to TTF python script if you want to know more about this. It can be found at my GitHub account.

Next time, I’ll talk a bit about how to map all the characters from the native C64 format into PETSCII, ASCII, and Unicode.

What does a TrueType font look like on the inside? And how do you make one? (Part I)

So, here the other day (actually a few months ago) I was looking for some retro-looking 8×8 pixel bitmap fonts for a project involving an old flip-dot display at My Friendly Local Hackerspace™. During this search I came across this website with more than 600 character sets from various old Commodore 64 games, applications, and demos. However, they are all in a very raw format where they are basically just partial memory dumps from running C64 games/demos. The author even mentions that he hasn’t found any easy way to convert them to a more useful format like, for example, TrueType. In fact, a Google search indicates that only very few C64 character sets are available for download as TrueType files. Most notable are the ones by Style64. However, they all seem to be more or less converted by hand using various font authoring tools. Well that’s not very elegant…

Somebody ought to do something!

Let’s explore what a TrueType font file looks like on the inside so we can create one ourselves. As I’ll cover later, it turns out to be quite possible to do with a bit of coding effort. In fact we don’t even have to do all the dirty work moving bits around and calculate checksums in a binary Truetype font file ourselves. There is (of course) a nice Python package called TTX/FontTools that can help us out. It encapsulates all the relevant data tables, as they are called, but it’s still fairly close to “the metal” and rather difficult to get started with.

The main use-case for TTX/FontTools seems to be TTX, which is a command-line tool for converting TrueType files into a corresponding XML-format and vice versa. Users can then manipulate a font in various ways using a basic text editor rather than sophisticated font editor programs, where it can be difficult to see what actually happens to the font behind the scene. But for our particular use-case we are not interested in the tool itself, but rather what makes it tick. It is really difficult to find any documentation or tutorials for this package. Especially if one wants to create a new font from scratch instead of just editing an existing one. I’ll get back to this later.

This post is meant as an introduction to the subject. All the dirty details will be fleshed out in upcoming posts. I have implemented a conversion tool in Python and if you can’t wait for the details, you can have a sneak-peek of the code on GitHub.

The problem in a nutshell

OK, so how do we get from a C64 memory dump containing some 8×8 pixel bitmapped characters to a usable TrueType file? The problem can be split into the following sub-problems:

  1. Vectorizing the 8×8 pixel bitmaps into glyph into a set of contours.
  2. Mapping from the native C64 format into ASCII (and Unicode).
  3. Generating the actual TrueType file using TTX/FontTools.

I’ll address these three sub-problems across the next three blog posts.

Useful software:

  • Python – A very nice programming language. Like Perl but less painful and much prettier.
  • TTX/FontTools – Without this package I probably wouldn’t have bothered with TrueType.
  • FontForge – A TrueType font editor. Nice for checking the sanity of font files.

If your operating system is a derivative of Debian Linux (like Ubuntu or Linux Mint) then Python is probably pre-installed and the other two packages are easily installable through the built-in package system. It’s also pretty easy to get it to work in Mac OS X. It probably also works in Windows, but then you’re on your own..

Useful links:

The TrueType file format at a glance

It seems that the file format specification varies a bit depending on who you ask. Traditionally, there are three big players in this field, Microsoft, Apple, and Adobe, and they don’t agree 100% on what a proper TrueType file should look like. I will primarily be using Microsoft’s definition, as Apple’s specification on required tables in the file lacks the “OS/2” table, which is used by Microsoft Windows itself as well as Microsoft Internet Explorer when loading fonts from a website. There are some licensing bits in here that tells Internet Explorer if it’s OK to download and use this font.

Basically, a TrueType file is a set of tables. Each of these tables describe a certain aspect of the font. For my particular purpose I can leave out features like kerning, hinting, ligatures, and all other fancyness that’s useful for working with proportional fonts. My goal here is to convert monospaced 8×8 pixel bitmaps into proper TrueType glyphs. The required tables for a bare-bones font are as follows:

Table nameTable description
cmapCharacter to glyph mapping
glyfGlyph data
headFont header
hheaHorizontal header
hmtxHorizontal metrics
locaIndex to location
maxpMaximum profile
nameNaming table
postPostscript information
OS/2OS/2 and Windows specific metrics

A detailed description of these tables are outside the scope of this post, but it’s all there in the specifications I linked above. As mentioned earlier, I didn’t succeed in finding a tutorial for creating font files from scratch using TTX/FontTools. It requires a deep knowledge of the TrueType format, but it can be done by reading the FontTools code (as well as the specifications) and doing some trial-and-error using the XML output feature. Basically you just need to fill in all the data mentioned in the specification. There are very few shortcuts in the process. But more on this in a later blog post…

In my next post, I’ll discuss the vectorization algorithm for converting a 8×8 pixel bitmap into a set of polygon contours. Stay tuned…

Using the hardware on an Arduino UNO

In this post we’ll go though what it takes to configure some Arduino libraries for the nRF24L01 modules and the DHT22 sensors. The hardware will in both cases be an Arduino UNO with the perf board shield described in my last post.

How to probe a DHT22 sensor from an Arduino

Let’s start by looking at how to talk to a DHT22. The DHT22 sensor uses a homemade 1-wire protocol for communicating with its host. The data transmission is initiated by the host by pulling the data pin low for 20 ms. Then the host pulls the data pin high for 40 ms. Finally, the sensor will transmit 40 bits by pulsing the data pin. Short pulses (26-28 microseconds) mean 0 and long pulses (70 microseconds) mean 1. Bytes 0 and 1 are the relative humidity and bytes 2 and 3 are the temperature. In both cases the first byte is the integral part while the second byte is the decimal part. The final byte is a checksum, which is simple the least significant byte of the sum of the previous 4 bytes. See the data sheet for more details on this.

DHT22 protocol

DHT22 handshake (as shown in the data sheet)

Luckily, all the hard work has been taken care of. To get started, grab a copy of Adafruit’s DHT22 library and unpack it to your Arduino library folder. Then open the Arduino IDE and open the DHT/DHTtester example. The only piece of configuration needed is which pin the sensor’s data pin is connected to. In my case it is analog input pin A5, which can also be used as digital pin 19. I simply changed #define DHTPIN 2 to #define DHTPIN 19. Upload the compiled code and open the serial monitor. Remember to set the baud rate to 9600. If all went well, you should be greeted with something like this:

DHTxx test!
Humidity: 23.90 % Temperature: 26.20 *C
Humidity: 23.80 % Temperature: 26.20 *C

The library code looks simple enough to optimize for size. We don’t need all the bells and whistles for our sensor nodes.

How to make a configure and use an nRF24L01 radio module from an Arduino

There is a great data sheet for the chip at Nordic Semiconductor’s website. From this data sheet it’s entirely possible to write a library from scratch. But for prototyping it’s better to stand on the shoulders of giants instead of re-inventing the wheel. Let’s use an existing library.

As I’ve mentioned earlier, there are already great libraries for this online. Basically, there are two worth mentioning: Maniacbug’s RF24 library and the smaller Mirf library. We will be using the former as it’s the most complete of the two. I have noticed that there are several forks of this library on GitHub, so it may be best to shop around a bit to find the best match for our purposes. Download a zip and expand the contents to your Arduino libraries folder.

We are going to test radio connectivity using the RF24/pingpair_dyn example. There are lots of settings to configure, but as a bare minimum we need to configure which pin is CE, which pin is CSN, and the role of the node (i.e. if we are the pinging part or the ponging part of the pair). Conveniently, the defaults for CE and CSN are the ones I’m using (i.e. digital pins 9 and 10). This can be changed in line 26 where it says RF24 radio(9,10);. Remember that no matter which pins you use, you must have pin 10 configured as an output for the SPI hardware to work in master mode. Else, it will run in slave mode and the code won’t work.

The default behavior for the RF24/pingpair_dyn example is to be the pinging part. Let’s just keep it that way and configure the Raspberry Pi to be the ponging part. Now try to compile and upload the code. Without a pong-partner, the pings will just time out, but at least we know something is working. Remember that this test uses 57600 baud per default when using the serial monitor. The output should look something like this:

RF24/examples/pingpair_dyn/
ROLE: Ping out
STATUS = 0x0e RX_DR=0 TX_DS=0 MAX_RT=0 RX_P_NO=7 TX_FULL=0
RX_ADDR_P0-1 = 0xf0f0f0f0e1 0xf0f0f0f0d2
RX_ADDR_P2-5 = 0xc3 0xc4 0xc5 0xc6
TX_ADDR = 0xf0f0f0f0e1
RX_PW_P0-6 = 0x20 0x20 0x00 0x00 0x00 0x00
EN_AA = 0x3f
EN_RXADDR = 0x03
RF_CH = 0x4c
RF_SETUP = 0x07
CONFIG = 0x0f
DYNPD/FEATURE = 0x3f 0x04
Data Rate = 1MBPS
Model = nRF24L01+
CRC Length = 16 bits
PA Power = PA_HIGH
Now sending length 4...Failed, response timed out.
Now sending length 6...Failed, response timed out.
Now sending length 8...Failed, response timed out.
Now sending length 10...Failed, response timed out.

If something is wrong (e.g. if the SPI interface has been configured incorrectly), the code will fail to recognize the radio. Then the output in the serial monitor will look like this:

RF24/examples/pingpair_dyn/
ROLE: Ping out
STATUS = 0xff RX_DR=1 TX_DS=1 MAX_RT=1 RX_P_NO=7 TX_FULL=1
RX_ADDR_P0-1 = 0x0000000000 0x0000000000
RX_ADDR_P2-5 = 0xff 0xff 0xff 0xff
TX_ADDR = 0xffffffffff
RX_PW_P0-6 = 0x00 0x00 0x00 0x00 0x00 0x00
EN_AA = 0xff
EN_RXADDR = 0xff
RF_CH = 0xff
RF_SETUP = 0xff
CONFIG = 0xff
DYNPD/FEATURE = 0x00 0x00
Data Rate = 1MBPS
Model = nRF24L01
CRC Length = 16 bits
PA Power = PA_HIGH
Now sending length 4...Got response size=255 value=ÿÿÿÿÿÿÿÿÿÿÿÿÿÿÿÿÿÿÿÿÿÿÿÿÿÿÿÿÿÿÿ
Now sending length 6...Got response size=255 value=ÿÿÿÿÿÿÿÿÿÿÿÿÿÿÿÿÿÿÿÿÿÿÿÿÿÿÿÿÿÿÿ
Now sending length 8...Got response size=255 value=ÿÿÿÿÿÿÿÿÿÿÿÿÿÿÿÿÿÿÿÿÿÿÿÿÿÿÿÿÿÿÿ
Now sending length 10...Got response size=255 value=ÿÿÿÿÿÿÿÿÿÿÿÿÿÿÿÿÿÿÿÿÿÿÿÿÿÿÿÿÿÿ

Assuming all went well, we are now done testing the Arduino libraries. Ultimately, they will be used as inspiration for the sensor node firmware. My next post will be about getting the Raspberry Pi to talk to the radio modules. In the end we should have a working ping/pong test running.

Making prototype perf board hardware

In my last post, I described the various electronic components in my soon-to-be wireless thermo- and hygrometer. In this post, we’ll look at how to wire up some prototype perf boards.

Connecting an nRF24L01 module and a DHT22 sensor to an Arduino

An nRF24L01 radio module communicates with its host using SPI. Luckily for us, the Arduino (as well as most of the Atmel AVR chips in general) supports SPI directly in the hardware. The hardware SPI pins on the Arduino UNO are digital pins 11 (MOSI), 12 (MISO), and 13 (SCK). Furthermore, we need to wire up the radio module’s pins for CSN (Chip Select), CE (Chip Enable), VCC (3.3V), and GND. There’s also a pin called IRQ, but it seems to be used less commonly. All I/O pins are 5V tolerant, but VCC must not be above 3.6V according to the datasheet. This means that we don’t need to have a level-converter chip in order to use the radio module with an Arduino.

nRF24L01

nRF24L01

I connected the module to my Arduino board like this:

nRF24L01 pin: Arduino pin:
1 (GND) GND
2 (VCC) 3.3V
3 (CE) Digital pin 9
4 (CSN) Digital pin 10
5 (SCK) Digital pin 13
6 (MOSI) Digital pin 11
7 (MISO) Digital pin 12
8 (IRQ) Digital pin 8

Please note that the SPI pins are totally different on Arduino Leonardo boards, where they can only be accessed through the ICSP pin header. Backward compatibility FTW…

The DHT22 sensor is much simpler to hook up. It has four pins, but we only need three of them. I would have liked to use one of the remaining “traditional” digital pins on the Arduino, but due to the infamous pin header alignment bug, it’s much easier to reconfigure one of the analog input pins as a digital pin when using perf board. I have used pin A5, which is also known as digital pin 19.

DHT22 pin: Arduino pin:
1 (VCC) 5V (3.3V would probably also work)
2 (DATA) Digital pin 19
3 (N/C)
4 (GND) GND

According to the datasheet, there’s supposed to be a pull-up resistor from the data pin to VCC. In practice it seems that the weak internal pull-up in the ATMEGA chip is enough. The sensor uses a weird 1-wire protocol on the data-pin, but fortunately we have the library provided by Adafruit.

With this knowledge it is just a matter of finding a suitable piece of perf board and the various needed bits and pieces. I must say that I never thought I would find a purpose for this exact piece of scrap perf board, but in this case it’s perfect.

Arduino shield

Arduino shield

When mounted it looks like this:

Arduino with nRF24L01 and DHT22

Arduino with nRF24L01 and DHT22

Connecting an nRF24L01 module to a Raspberry PI

Now we are ready for part two of this post. Again, we are going to use the hardware SPI port provided by the hardware. All the pins we need are located in the big 26-pin P1 header. There’s a nice write-up about P1 (and the other headers) on eLinux.org. I have connected the nRF24L01 module like this:

nRF24L01 pin: Raspberry PI pin (P1 header):
1 (GND) 20 (GND)
2 (VCC) 17 (3.3V)
3 (CE) 16 (GPIO 23)
4 (CSN) 18 (GPIO 24)
5 (SCK) 23 (SCLK / GPIO 11)
6 (MOSI) 19 (MOSI / GPIO 10)
7 (MISO) 21 (MISO / GPIO 9)
8 (IRQ)

This is mostly based on the documentation for this code I found while researching how to connect the parts. It is a Raspberry Pi port of a Beagleboard port of Maniacbug’s nice RF24 library for Arduino. The author writes that he doesn’t know if it works or not. Well it doesn’t. Not right away at least. It took some work to get running, but I’ll get back to that in the next post.

My adaptor board:

nRF24L01 adaptor board for Raspberry Pi

nRF24L01 adaptor board for Raspberry Pi

And mounted on the Pi with a radio module:

Mounted adaptor board

Mounted nRF24L01 adaptor board on Raspberry Pi

That’s it! Our prototype hardware is finished. In the next post I’ll explain how to get a simple ping/pong test working.

New Project: Wirelesss thermo- and hygrometer

Let’s start this blog out by looking at a project..

So, wouldn’t it be cool to have the ultimate open source (well, mostly) indoor/outdoor thermo- and hygrometer with multiple wireless sensors and a sleek HTML5 based interface? Of course it would! I’m not the first one to make one of these. In fact, the guy who made the Arduino library for the radio modules I’m going to use has made something very similar: Low-Power Wireless Sensor Node

I often pick my projects in order to learn some new skill or technology. But in this case there’s also a potentially useful gadget in the end. The new technologies for me this time will be energy-efficient embedded design, wireless communications, backend design (perhaps even some NoSQL), and a dynamically updated HTML5 frontend. Oh, and responsive design. It must look nice on both “real” computers and tablets/phones.

Some preliminary features and specifications:

  • Raspberry PI as base station
  • nRF24L01+ based radio modules
  • DHT22 temperature & humidity sensors
  • Battery-powered Atmel ATTiny based sensor boards
  • Arduino Uno as prototype platform for the sensor boards
  • HTML5 based frontend (WebSockets, SVG graphics, …)
  • Database backend that stores all measurements (perhaps MongoDB)

Let’s look over these features one by one.

Raspberry PI as base station

RPI

Raspberry PI – Model B

Every hobby project needs either a Raspberry PI or an Arduino to score blogosphere points, amirite? Besides, it’s also offers good value for money. At Open Space Aarhus, my friendly local hackerspace, we recently did a group-buy of these. We ended up paying 275 DKK (approx. $47) including taxes and shipping for a B-model. That’s not too bad considering the Danish 25% VAT..

But why a Raspberry Pi, you might ask. Well, besides its relatively powerful CPU, good Linux support, and built-in LAN interface, it also provides hardware SPI pins in its GPIO header. This is very useful for communicating with the radio modules described below.

nRF24L01+ based radio modules

nRF24L01+ module

nRF24L01+ module

I used to think that 2.4GHz wireless modules were too expensive for a project like this. Not anymore! These bad boys cost me $1.20 apiece on Ebay. I got 10 of them, so if I don’t break any I’ll end out with 10 wireless sensor modules. The nRF24L01 chip (and cheap modules) has become quite popular among hobbyists it seems. Well, count me in. So instead of messing around with RF design and other low-level radio stuff, I can concentrate on a nice and tidy SPI based interface where all the gritty details have been taken care of. It’s even battery-friendly due to its multiple sleep modes. More on this later…

nRF24L01+ module with PA and LNA

nRF24L01+ module with PA and LNA

For the base station I’ve chosen a much more potent radio module. It uses the same chip, but with additional amplifiers and a proper antenna. It cost me more than all the other radio modules combined, but it’s an attempt at extending the range of the system. Besides the amplifiers, the board is more or less identical to the others. The pin header is exactly the same.

Of course, someone already implemented an Arduino library for these modules: Getting Started with nRF24L01+ on Arduino

It has even been ported to work with the SPI hardware on the Raspberry PI: RF24RP

It took me a bit of debugging to get the example code running on the Pi. I’ll get back to that in a later post.

DHT22 temperature & humidity sensors

AM2302

AM2302

There’s not much sense in making sensor nodes without sensors. I considered several alternatives until I noticed the DHT22 sensor type. It’s a combined temperature and humidity sensor with a very good range (0…100% RH and -40…125 degrees Celsius) and adequate precision for this purpose (+/- 2-5% RH and +/- 0.5 degrees Celcius).

I found a great deal on AM2302 sensors on Ebay. They are basically the same as DHT22. My preliminary tests indicate that they are sufficiently accurate.

Adafruit has made an Arduino library for it: DHT-sensor-library

Battery-powered Atmel ATTiny based sensor boards

In order for this project to be a success, the sensor nodes must be able to run for several months between battey changes. It might be better to pursue other architectures than Atmel AVR (e.g. the very power efficient TI MSP430 series), but the Atmel MCUs are familiar to me.

At some point I will draw up some PCBs for this. Stay tuned…

Arduino Uno as prototype platform for the sensor boards

Arduino Uno

Arduino Uno

At the early stages of the project, it’s nice to have a simple prototype platform. I’m using an Arduino for this. When the code starts to mature, I’ll switch to a custom prototype board based on an ATTiny chip.

HTML5 based frontend (WebSockets, SVG graphics, …)

Continuously updating sensor measurements provide a nice real-life data source for a dynamic HTML5 website. More on this later… 

Database backend that stores all measurements (perhaps MongoDB)

I want to store all measurements in order to make various statistics. Both simple stuff like the temperature development during the last 24 hours as well as more advanced calculations are interesting. More on this later…

Next stop: Make prototype perf board hardware